All posts
#2 BenchmarkBiomedical imaging · 11 min read
A simple model out-forecast a retrained competition-winning method on lung decline
By Edmund Miller and Harshil Patel

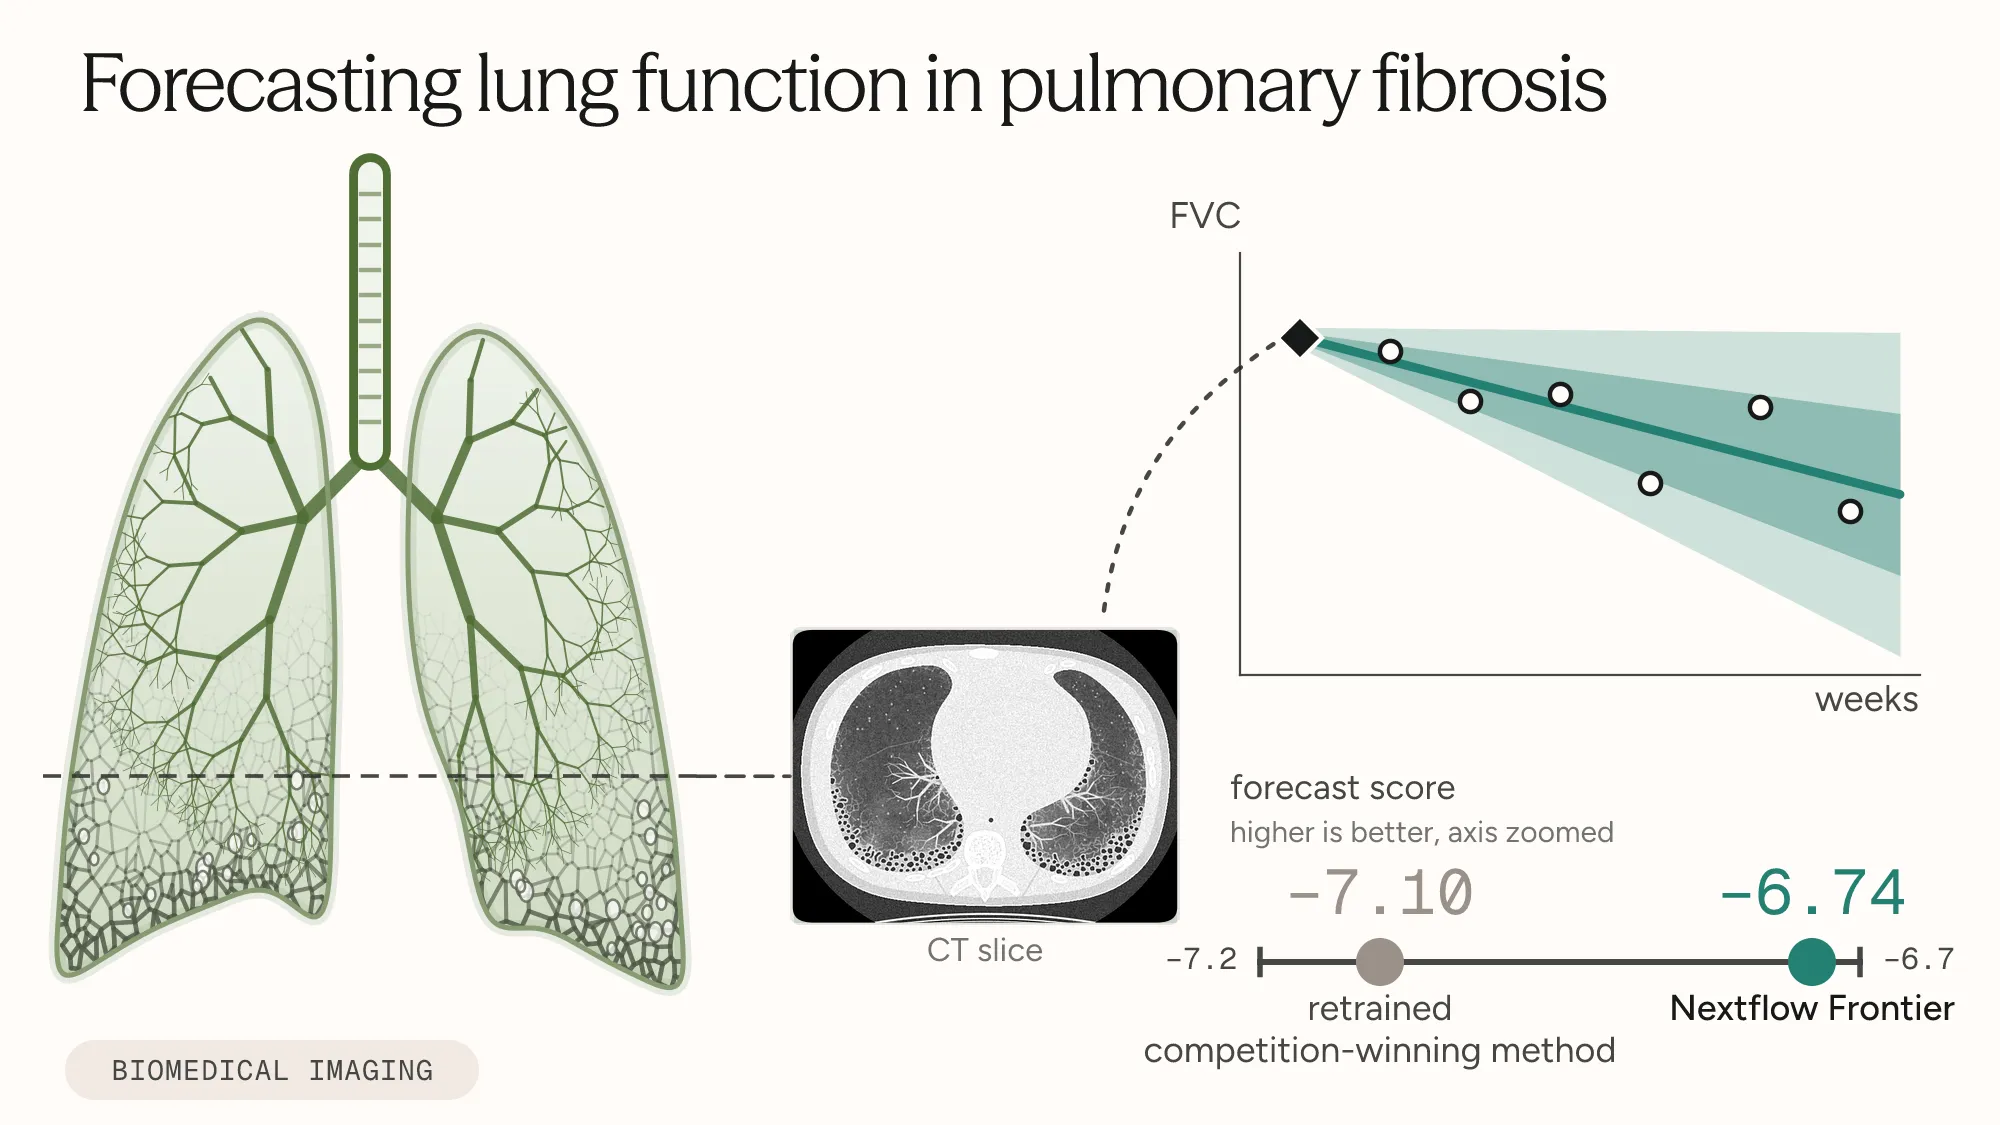
Forecasting how fast a person's lung function will decline could help patients and physicians plan treatment sooner, and help clinical trials identify patients most likely to decline. Nextflow Frontier built these forecasts for people with pulmonary fibrosis, a scarring lung disease, using one CT scan and a few clinical facts. Its selected model predicted later lung-function measurements for 18 evaluation patients more accurately than the retrained competition-winning method.
Why forecasting lung function matters
Forecasting how fast a scarred lung will lose function is hard, because pulmonary fibrosis moves at very different speeds in different people and a CT scan, a stack of X-ray images that slice through the chest, shows the lung at a single moment. In idiopathic pulmonary fibrosis, the form whose cause is unknown, the tissue around the lungs’ air sacs thickens and scars, which makes breathing progressively harder, and the scarring can advance slowly over years or quickly (NHLBI 2023). Physicians track it with forced vital capacity (FVC), the volume of air a person can blow out after the deepest breath they can take.
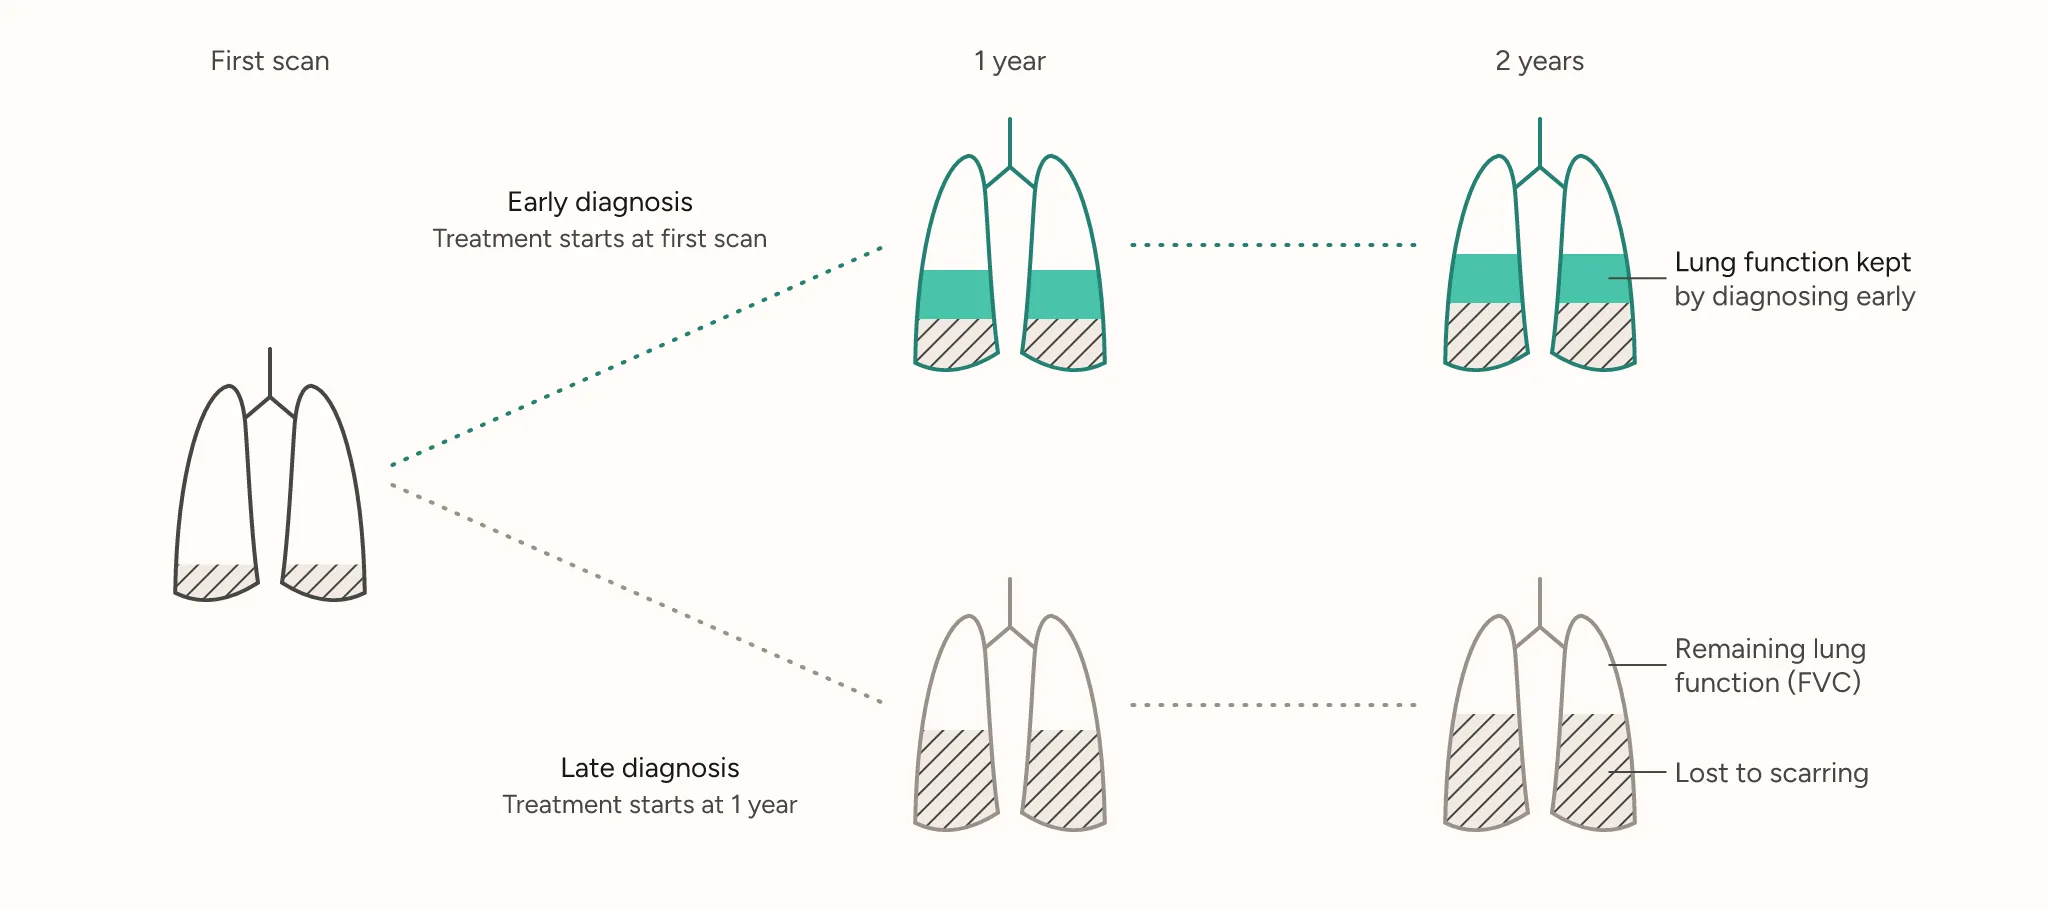
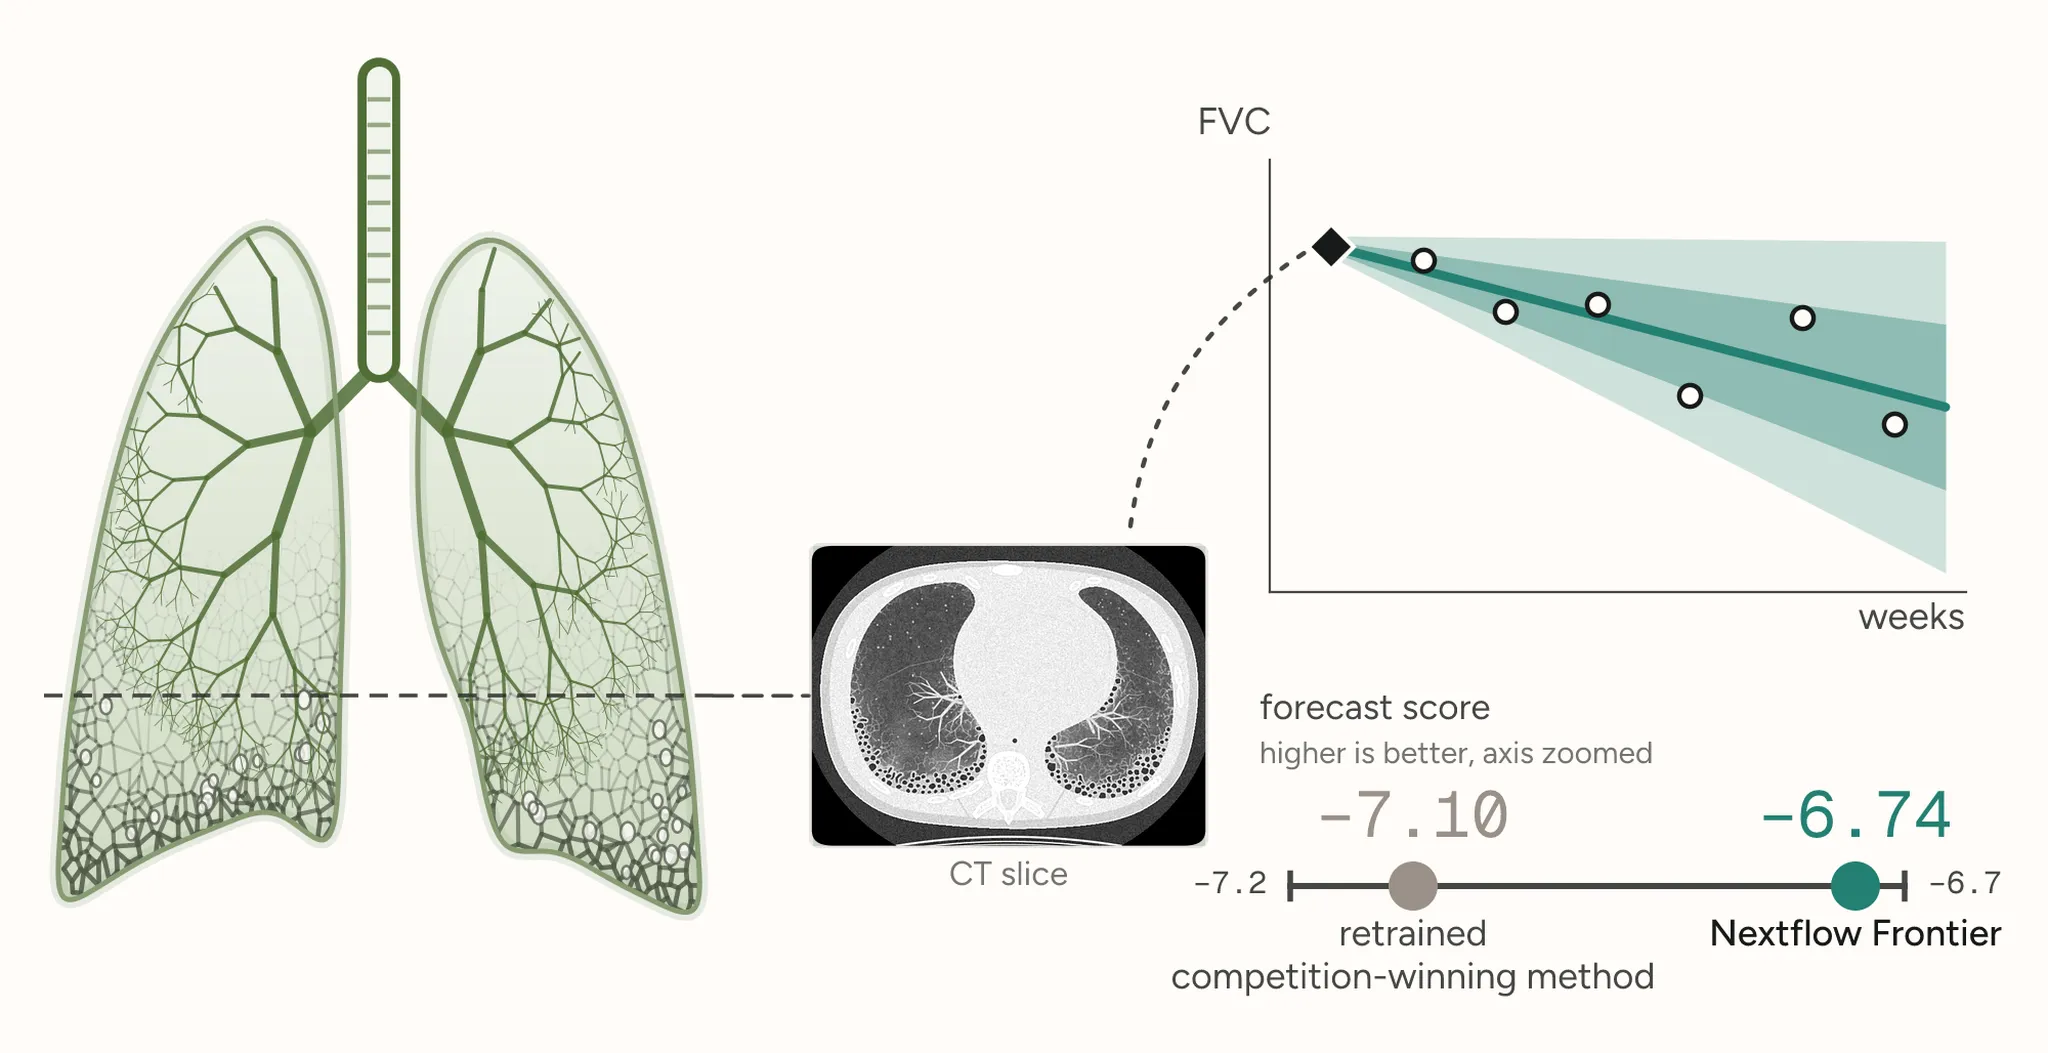
For a patient, a forecast of fast decline would mean arranging specialist care and agreeing a treatment plan with their physician early (Figure 1), and it would also help drug trials. The first two drugs approved for the disease were judged by how much they slowed the fall in FVC over a year (Richeldi et al. 2014; King et al. 2014), and a third, approved in October 2025, on the change in FVC too (US FDA 2025). Because that fall varies so much between people, trials need many patients, and the US Food and Drug Administration describes enrolling patients likely to worsen as one way to make trials more sensitive (US FDA 2019). A physician also needs to know how far a forecast might be off before acting on it, so a useful forecast states its own margin of error.
Nextflow Frontier is designed to discover and optimize the method itself. Its Adaptive Discovery Model (ADM) proposes, builds, runs and scores each candidate model, learning from every result to determine what to try next in a continuous discovery loop. We used it to build the lung-function forecasts described here (Figure 2).
How the test was set up
The data come from a 2020 public competition that the Open Source Imaging Consortium (OSIC) ran on Kaggle, a data-science competition website (OSIC 2020). Each of its 176 training patients has one chest CT scan, their age, sex and smoking history, and FVC measured at a first visit and at several later check-ups. BioML-bench, a public collection of biomedical machine-learning tasks (Miller et al. 2025), split these patients into two groups. The 158 training patients come with their full histories, every FVC measurement included, and a method learns from them. The 18 evaluation patients come with only their starting point: the scan, the clinical facts and the first FVC measurement. A method forecasts each evaluation patient’s later FVC, and the forecasts are then compared with the measurements taken at those patients’ later check-ups, which the benchmark withholds from the method.
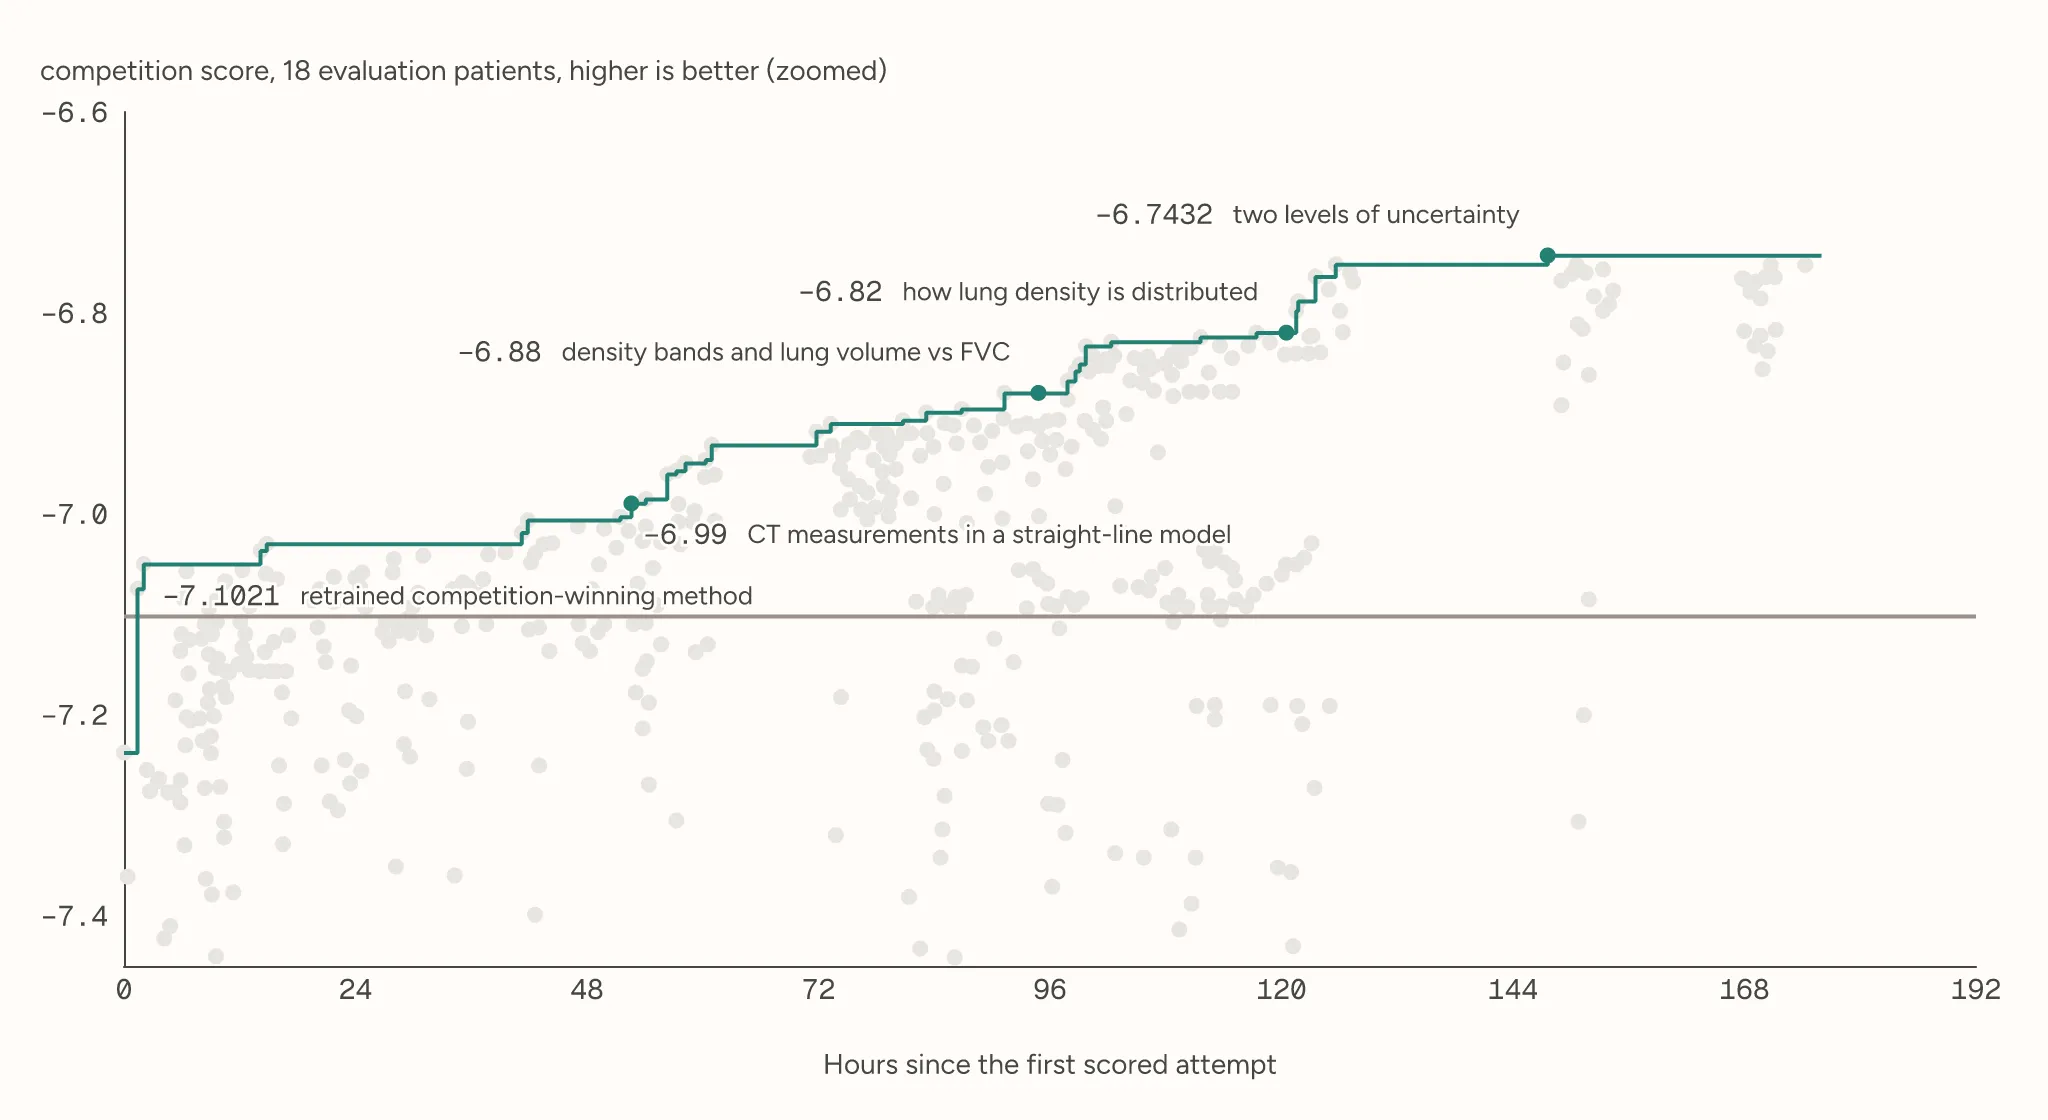
The competition’s own leaderboard was scored on hidden patients that were never used here, so the winning score on that leaderboard (Wong et al. 2021) cannot be compared with the scores reported here (Figure 3). Because the 18 evaluation patients’ histories are public, the winning model as published had learned from data that included them, so we retrained that method from scratch on the same 158 patients (Kulakov 2020). It blends two parts, the first a neural network (a layered model that learns patterns from examples) that reads slices of the CT scan together with the patient’s details and forecasts how steeply FVC will fall. The second is a pair of smaller networks that use only the clinical facts to give a low, middle and high forecast, whose spread sets the margin of error.
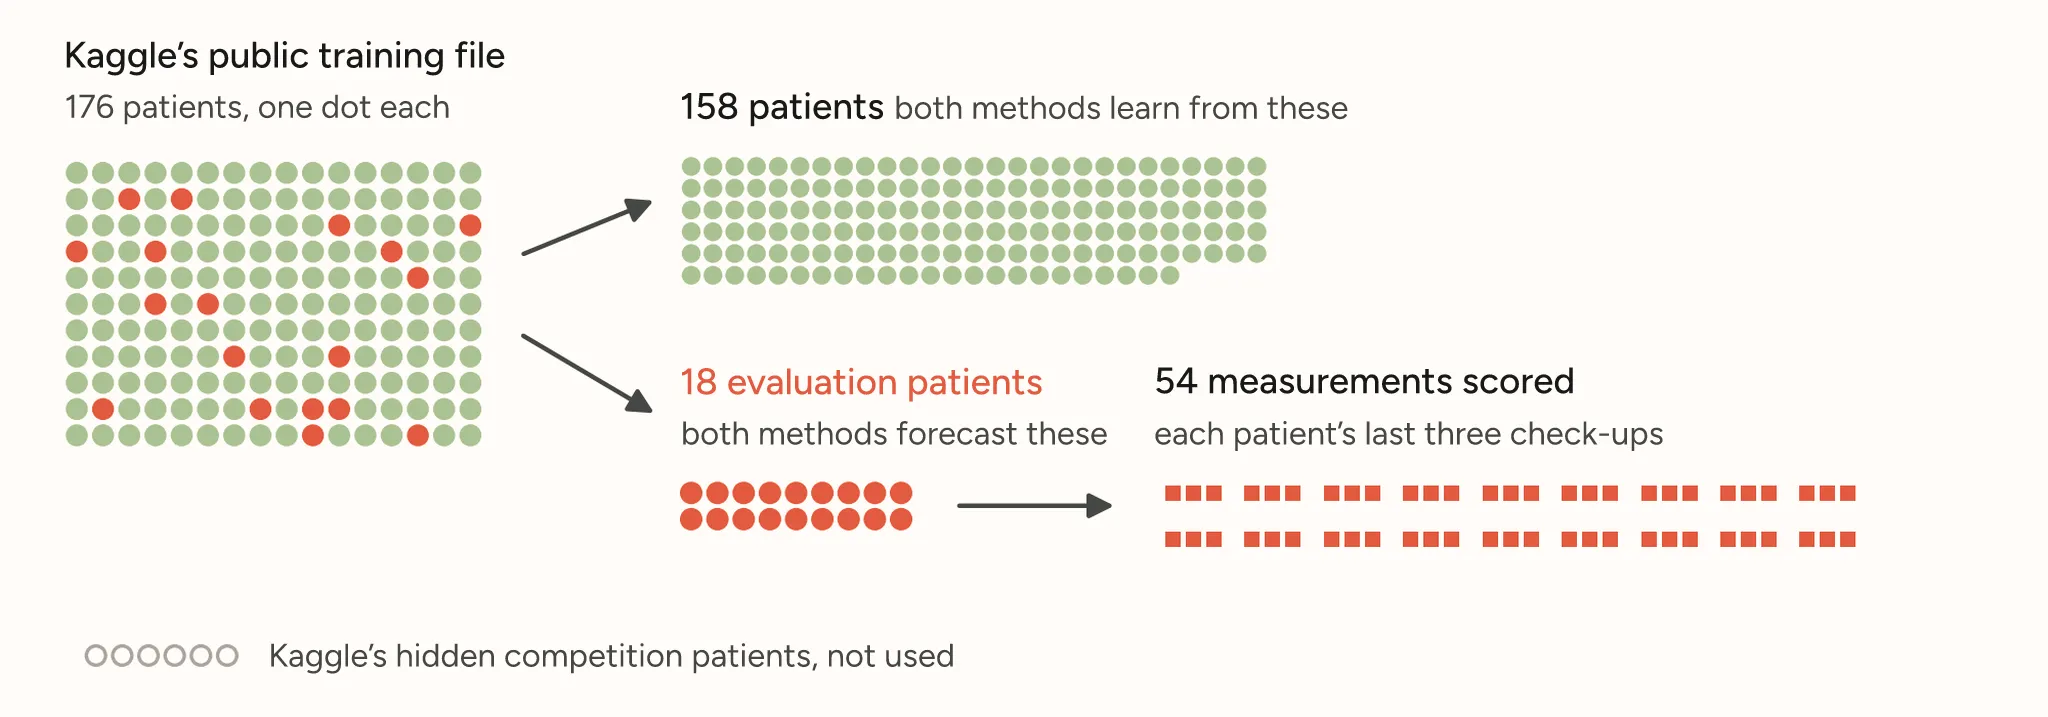
For each later week it is asked about, a method gives a forecast of FVC and a margin of error, both in milliliters, saying how far off it expects to be. The benchmark scores each evaluation patient’s last three check-ups, 54 measurements in all, with the competition’s rule: the closer the forecast, the better the score, and the margin of error has to fit, because claiming too much certainty and hedging too widely are both penalized.
How Nextflow Frontier built its forecasts
Over about seven days, Nextflow Frontier made 1,095 attempts, each scored on the same 18 evaluation patients. Its early results steered it away from neural networks that read the scan images, the approach the competition winner had used, because they scored worse than the simpler models from which they grew. It turned instead to measuring the lungs: it outlined them on each scan with a published lung-finding program (Hofmanninger et al. 2020), summarized each scan as a few numbers, and used those numbers with the clinical facts to forecast how fast each patient’s FVC would fall, with a standard linear model designed not to read too much into a small dataset. Because the score also judges the margin of error, several of its first attempts changed only how that margin widened for forecasts further ahead.
On a CT scan, scarred lung looks denser (Hartley et al. 1994). Three changes to the model then lifted its best score (Figure 4). First it added density bands, the share of the lung that falls in set ranges of density, and compared the lung’s size on the scan with the patient’s FVC, because a lung that looks large on the scan but breathes out little can point to emphysema, damage that leaves enlarged air spaces, alongside the fibrosis (Cottin et al. 2022). Next it added two more measures of lung density: how sharply the density readings peak at a typical value, and a high-end reading, the level that only the densest 10% of the lung exceeds.
For the third change, Nextflow Frontier combined the findings of two separate sets of its earlier attempts. One had found that the high-end density reading improved the forecasts. The other had found that the score rose when the model gave one margin of error to patients whose lungs looked large on the scan for their FVC and another to everyone else. The model that combined the two became the final one.
The result
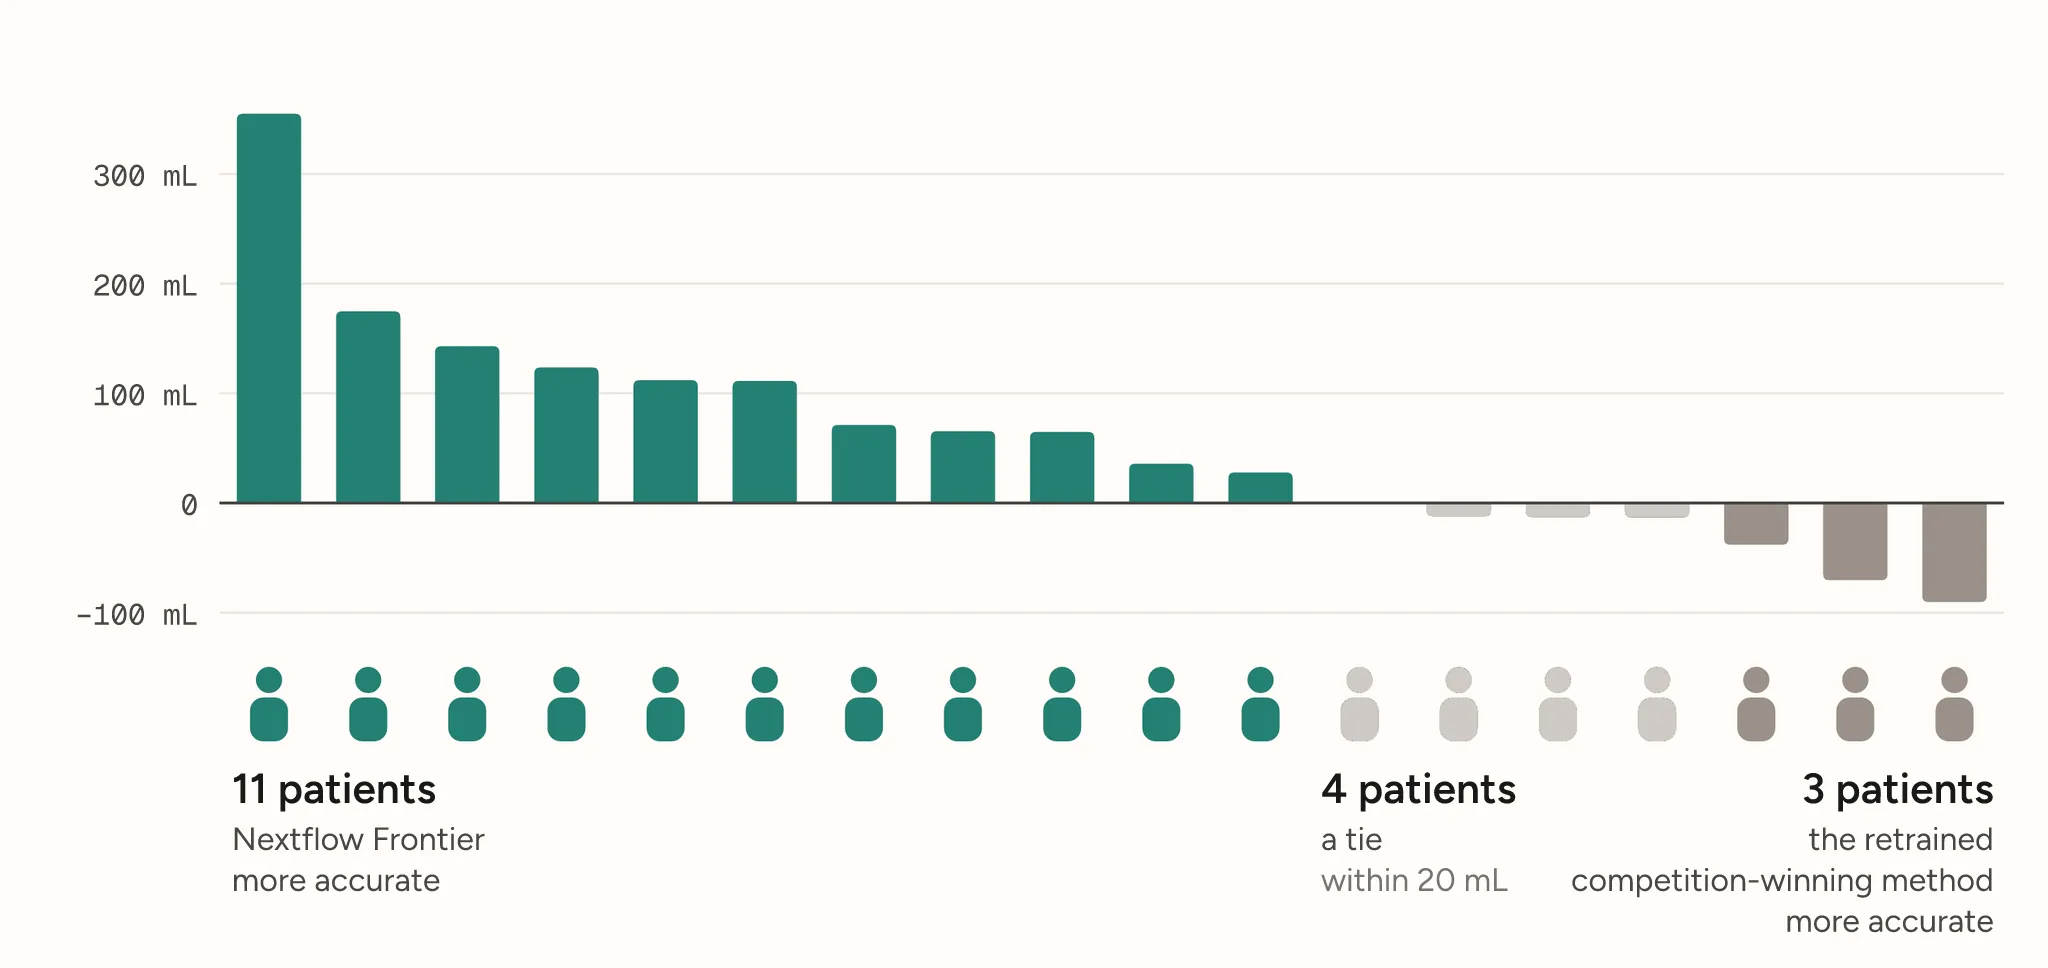
On the 54 later measurements, Nextflow Frontier’s forecasts missed the measured FVC by 170 mL on average, against 228 mL for the retrained competition-winning method. On the competition’s score, where closer to zero is better, Nextflow Frontier’s final model scored −6.74 and the retrained method −7.10; a gap of 0.36 means that, averaged over the 54 measurements, Nextflow Frontier’s forecasts rated the value later measured about 1.4 times as likely as the retrained method’s did. Most of its lead came from the closer forecasts rather than from its margins of error. To check whether the lead could come from which patients happened to be tested, we redrew the 18 patients at random 20,000 times, allowing a patient to be drawn more than once, and recomputed the lead each time; the middle 95% of those leads all favored Nextflow Frontier. Patient by patient, its forecasts came closer for 11 of the 18, the two methods were within 20 mL of each other for four, and the retrained method’s came closer for three (Figure 5).
What the result does not show
These results cover 18 patients from one public dataset, and Nextflow Frontier picked its measurements and settings, its two margins of error among them, according to their scores on those same patients. When we chose the settings again from the 158 training patients alone, its lead over the retrained method shrank to about a third of its original size, too small to tell apart from chance, and a version using only the clinical facts, with no CT measurements, forecast about as accurately as that re-tuned model. The test therefore shows that Nextflow Frontier found a simple model that forecast these patients well, but not yet that the lead would hold on new patients or that the scan measurements produced it. We retrained the competition-winning method only once, and because a neural network’s training starts from random values, another retraining could score differently, possibly better. An independent audit of the run’s records, covering the commands Nextflow Frontier ran, the files its tasks received and the scoring records, found no sign in what it examined that Nextflow Frontier saw the hidden follow-up measurements, and no patient’s care changed because of these forecasts.
What comes next
The clearest next test is to score both methods on new patients that neither has seen, with every setting fixed before those patients are scored, and to retrain the competition method several times from different random starting values. If the lead holds, a model this simple would give physicians a forecast at diagnosis and could make trials of new treatments smaller or quicker.
Summary
Nextflow Frontier built a simple, readable model of lung-function decline whose forecasts, for the 18 evaluation patients, came closer to the later measurements than the retrained competition-winning method’s did, 170 mL off on average against 228 mL. If that lead holds on new patients, physicians could have such a forecast, with its margin of error, at diagnosis, and trials could recruit the patients it expects to decline.
References
- Cottin V, Selman M, Inoue Y, et al. (2022). Syndrome of combined pulmonary fibrosis and emphysema: an official ATS/ERS/JRS/ALAT research statement. American Journal of Respiratory and Critical Care Medicine 206, e7–e41. doi:10.1164/rccm.202206-1041ST
- Hartley PG, Galvin JR, Hunninghake GW, et al. (1994). High-resolution CT-derived measures of lung density are valid indexes of interstitial lung disease. Journal of Applied Physiology 76, 271–277. doi:10.1152/jappl.1994.76.1.271
- Hofmanninger J, Prayer F, Pan J, et al. (2020). Automatic lung segmentation in routine imaging is primarily a data diversity problem, not a methodology problem. European Radiology Experimental 4, 50. doi:10.1186/s41747-020-00173-2
- King TE Jr, Bradford WZ, Castro-Bernardini S, et al. (2014). A phase 3 trial of pirfenidone in patients with idiopathic pulmonary fibrosis. New England Journal of Medicine 370, 2083–2092. doi:10.1056/NEJMoa1402582
- Kulakov A (2020). OSIC Pulmonary Fibrosis Progression 1st place solution (EfficientNet-B5 and quantile regression blend). GitHub repository artkulak/osic-pulmonary-fibrosis-progression, commit cd6dfa5, 8 October 2020. https://github.com/artkulak/osic-pulmonary-fibrosis-progression/commit/cd6dfa5
- Miller HE, Greenig M, Tenmann B, et al. (2025). BioML-bench: evaluation of AI agents for end-to-end biomedical ML. bioRxiv. doi:10.1101/2025.09.01.673319
- NHLBI (2023). What is idiopathic pulmonary fibrosis? National Heart, Lung, and Blood Institute, updated 26 June 2023. https://www.nhlbi.nih.gov/health/idiopathic-pulmonary-fibrosis
- OSIC (2020). OSIC Pulmonary Fibrosis Progression. Kaggle competition run by the Open Source Imaging Consortium. https://www.kaggle.com/competitions/osic-pulmonary-fibrosis-progression
- Raghu G, Remy-Jardin M, Richeldi L, et al. (2022). Idiopathic pulmonary fibrosis (an update) and progressive pulmonary fibrosis in adults: an official ATS/ERS/JRS/ALAT clinical practice guideline. American Journal of Respiratory and Critical Care Medicine 205, e18–e47. doi:10.1164/rccm.202202-0399ST
- Richeldi L, du Bois RM, Raghu G, et al. (2014). Efficacy and safety of nintedanib in idiopathic pulmonary fibrosis. New England Journal of Medicine 370, 2071–2082. doi:10.1056/NEJMoa1402584
- US FDA (2019). Enrichment strategies for clinical trials to support approval of human drugs and biological products: guidance for industry. US Food and Drug Administration, March 2019. https://www.fda.gov/regulatory-information/search-fda-guidance-documents/enrichment-strategies-clinical-trials-support-approval-human-drugs-and-biological-products
- US FDA (2025). FDA approves drug to treat idiopathic pulmonary fibrosis. US Food and Drug Administration news release on Jascayd (nerandomilast), 7 October 2025. https://www.fda.gov/drugs/news-events-human-drugs/fda-approves-drug-treat-idiopathic-pulmonary-fibrosis
- Wong A, Lu J, Dorfman A, et al. (2021). Fibrosis-Net: a tailored deep convolutional neural network design for prediction of pulmonary fibrosis progression from chest CT images. Frontiers in Artificial Intelligence 4, 764047. doi:10.3389/frai.2021.764047
Interested in Nextflow Frontier?
Nextflow Frontier is a closed-loop discovery system built on Nextflow. It designs computational experiments, runs each one as a reproducible pipeline and learns from every result’s score what to try next, under the supervision of scientists.

Filed under Biomedical imaging
All posts