All posts
#3 BenchmarkProtein engineering · 12 min read
A model 80 times smaller kept pace on protein stability
By Edmund Miller and Harshil Patel
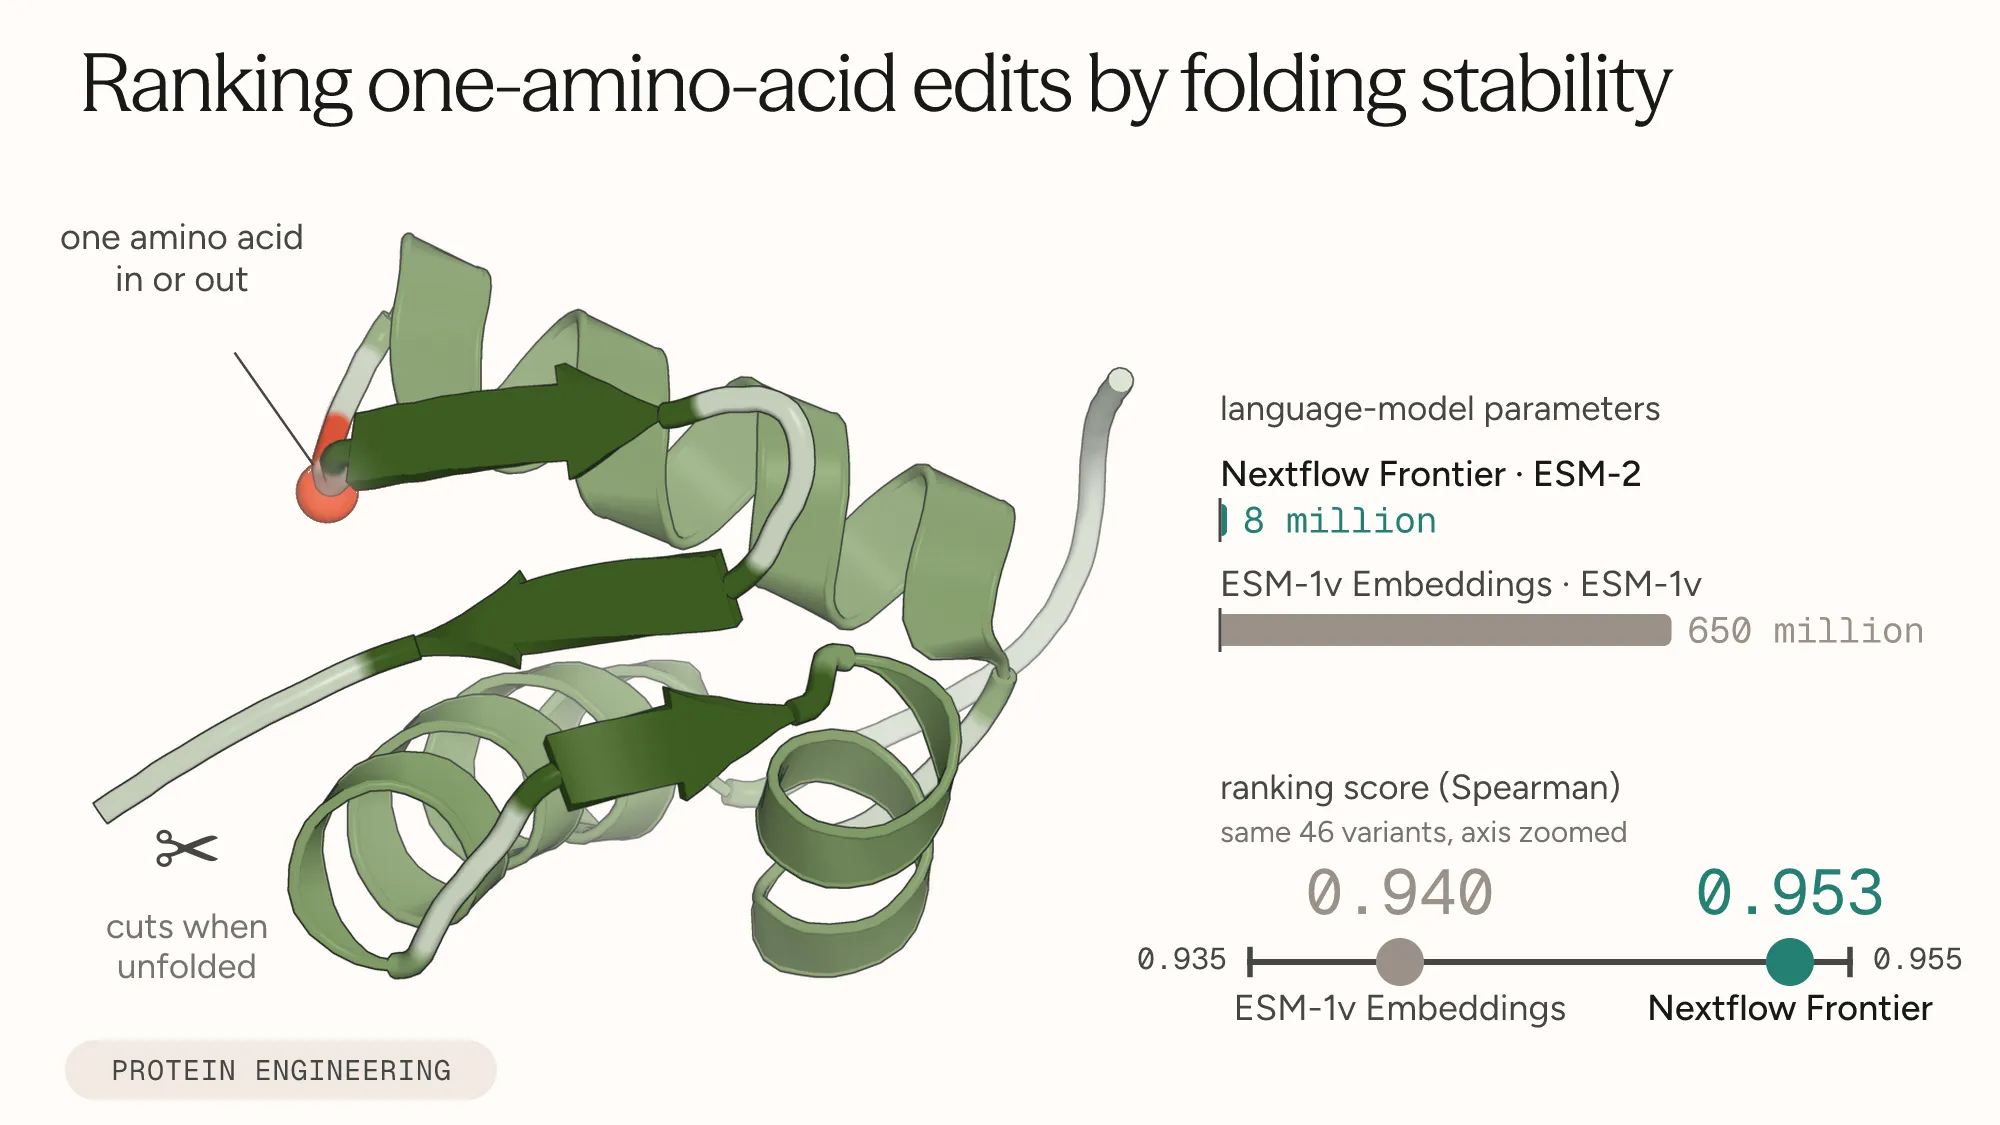
Nextflow Frontier trained a small protein model to rank edits that lengthen or shorten a protein by one amino acid. On 46 held-back variants of a mouse protein, its selected model scored 0.953 against 0.940 for ESM-1v Embeddings, the strongest published supervised method for this task. A score of 1 means a perfect ranking. Nextflow Frontier's approach uses a protein language model with about one eightieth as many parameters as the language model behind that method.
The recipe also scored close to the reference in broader reruns. Across 19 random starts, it averaged 0.934 on those same 46 variants. Under the full benchmark protocol, averaging predictions across the starts gave 0.913 against 0.906 for ESM-1v Embeddings. The uncertainty in that difference leaves neither method with an established lead. The size comparison concerns their language-model components. We did not measure runtime or cost.
Editing a protein can change how firmly it holds its folded shape. Predicting whether an edit will make the protein more or less stable is hard, especially when it makes the chain longer or shorter. Protein engineers use these edits to shorten flexible loops or lengthen linkers between parts of a protein (Savino et al. 2022; Chen et al. 2013). Reliable predictions would help them skip edits likely to fail. We used Nextflow Frontier to test approaches to this problem on a public benchmark. Its selected model ranked about 91 in every 100 pairs of unseen variants correctly, against about 89 for ESM-1v Embeddings on the same variants.
The smallest length change inserts or deletes one amino acid, a building block of the protein chain. Most published stability measurements concern swaps, where one amino acid replaces another (Savino et al. 2022), so far fewer measurements exist for insertions and deletions.
A protein holds its shape through many small forces between its amino acids. For example, water-avoiding side chains pack into its core. A swap can upset that balance (Pace et al. 2011). An insertion or deletion also shifts the position of every amino acid after it along the chain. That can disrupt a stretch of contacts unless a flexible loop absorbs the change.
The benchmark task
ProteinGym tests methods that predict the effects of protein changes (Notin et al. 2023a). This dataset uses a 72-amino-acid domain of mouse CSN4. A domain is a section of a protein that folds into its own compact shape. CSN4 is part of the COP9 signalosome, a complex that regulates protein degradation (Wei and Deng 2003; Lingaraju et al. 2014).
The method receives stability measurements for 149 of the domain’s 196 measured variants, each differing by one inserted or deleted amino acid. It must rank the remaining 47 from least to most stable without seeing their measurements.
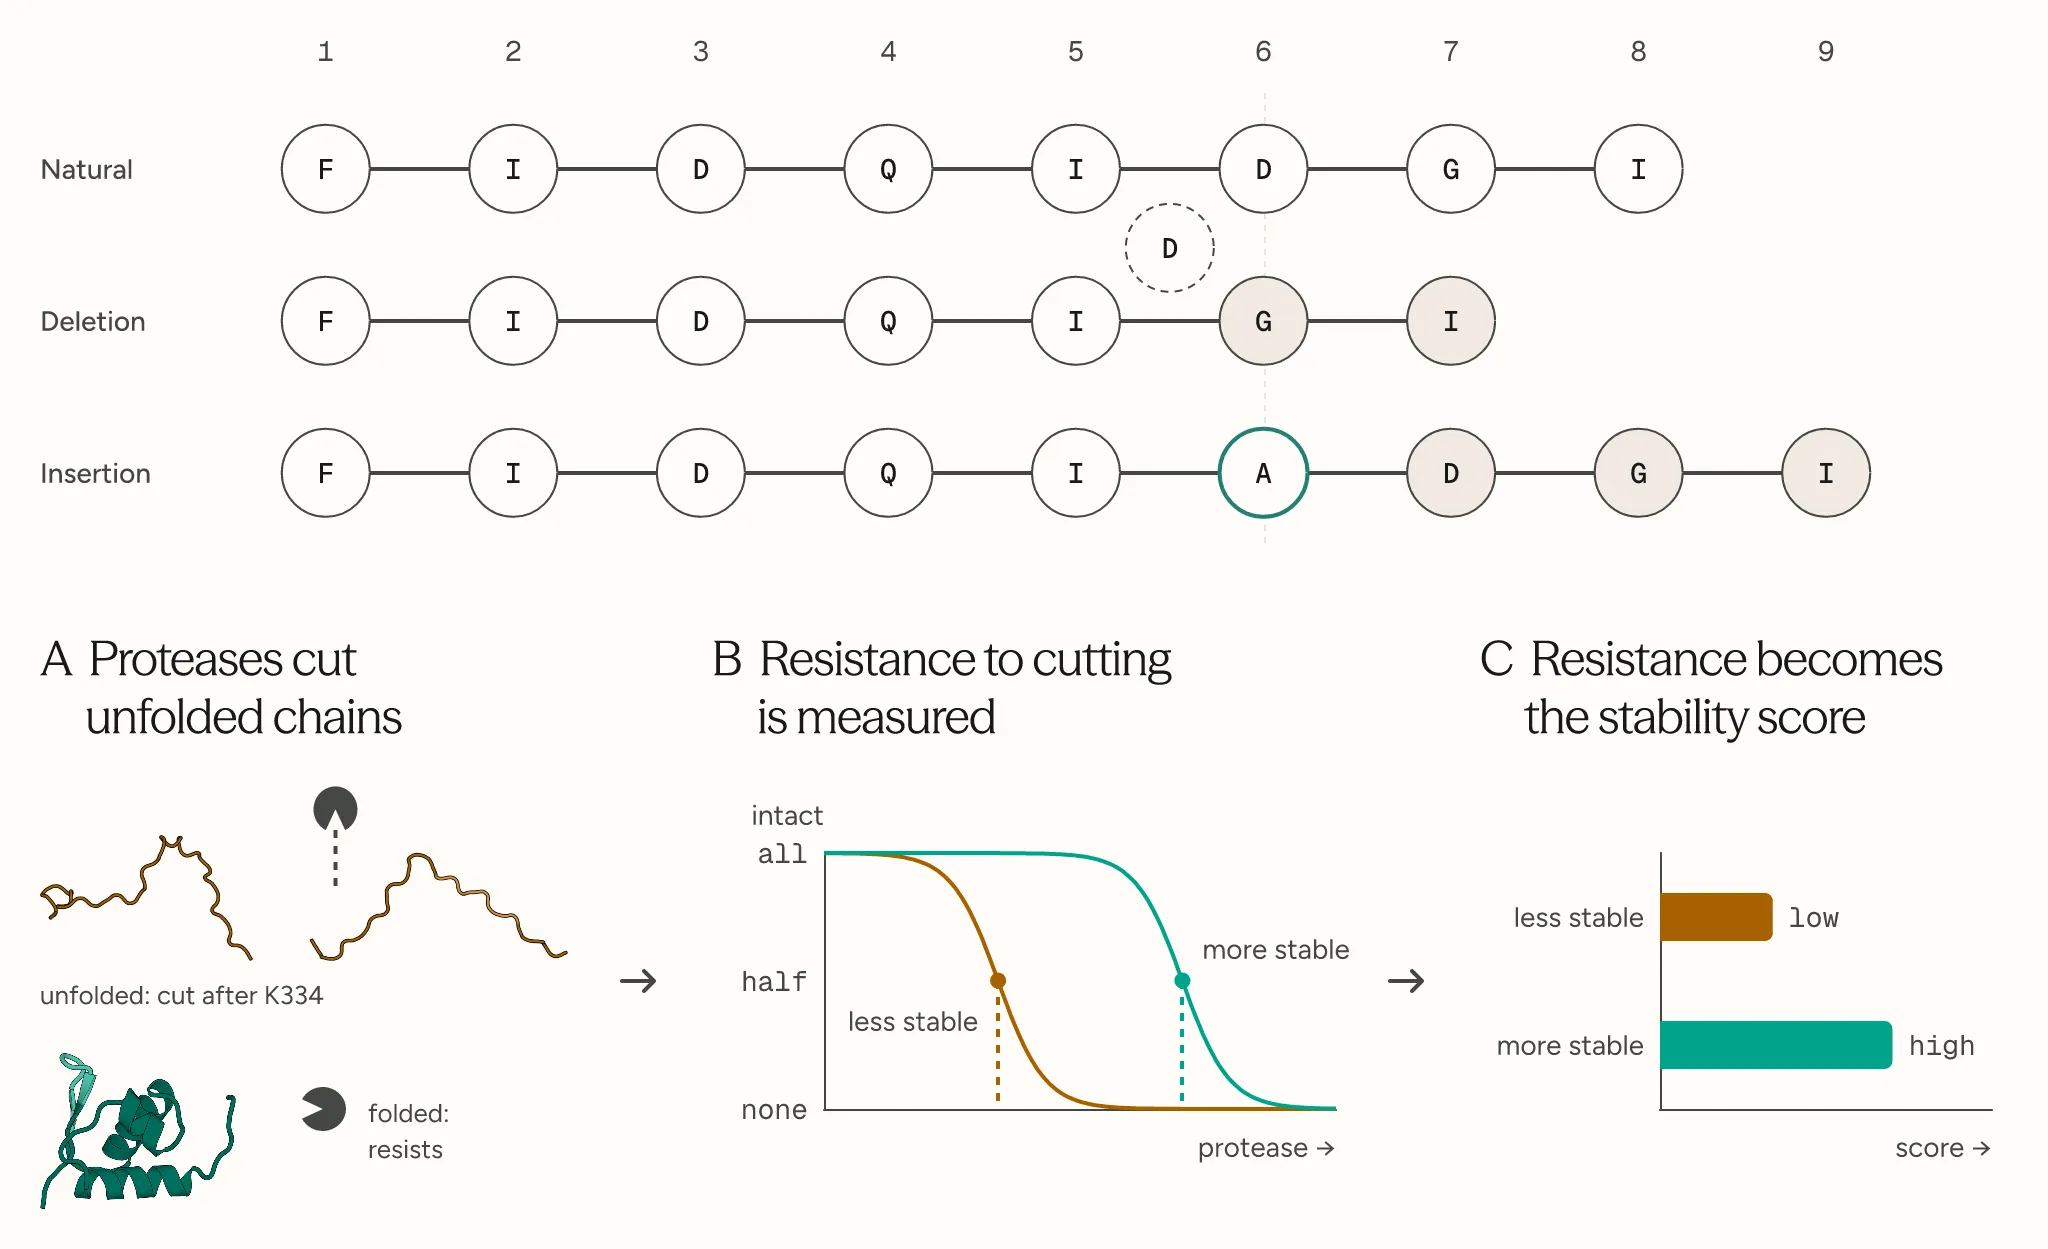
The measurements come from a 2023 study by Tsuboyama and colleagues. Their method can measure the folding stability of up to 900,000 protein domains in one week. It exposes a mixture of variants to proteases, enzymes that cut proteins apart, and records how much protease each variant withstands. Folded chains protect their cut sites, so proteases cut unfolded chains more easily. How much protease a variant withstands therefore gives a measure of its stability.
ProteinGym uses Spearman’s rank correlation to compare predicted and measured rankings. It runs from 1 for the same order through 0 to −1 for the reverse. We also report the share of variant pairs for which the model correctly predicts which variant is more stable. Random guessing gets 50 of every 100 pairs right. A perfect method gets all 100.
ProteinGym splits the 196 variants into five random groups of 47, 44, 39, 37 and 29. We confirmed that the hidden variants form the largest group. The split ignores the position of an edit along the chain. As a result, 45 of the 47 hidden variants occur at positions where a different edit was measured. The task tests predictions for missing measurements at mostly familiar positions. This resembles a lab measuring some edits, then asking which remaining edits are worth making.
How Nextflow Frontier built its model
Nextflow Frontier made 1,012 scored attempts over about a day and a half. It began with the protein’s structure, describing each variant by how tightly its amino acids pack inside the fold. This approach put 73 of every 100 pairs in the right order.
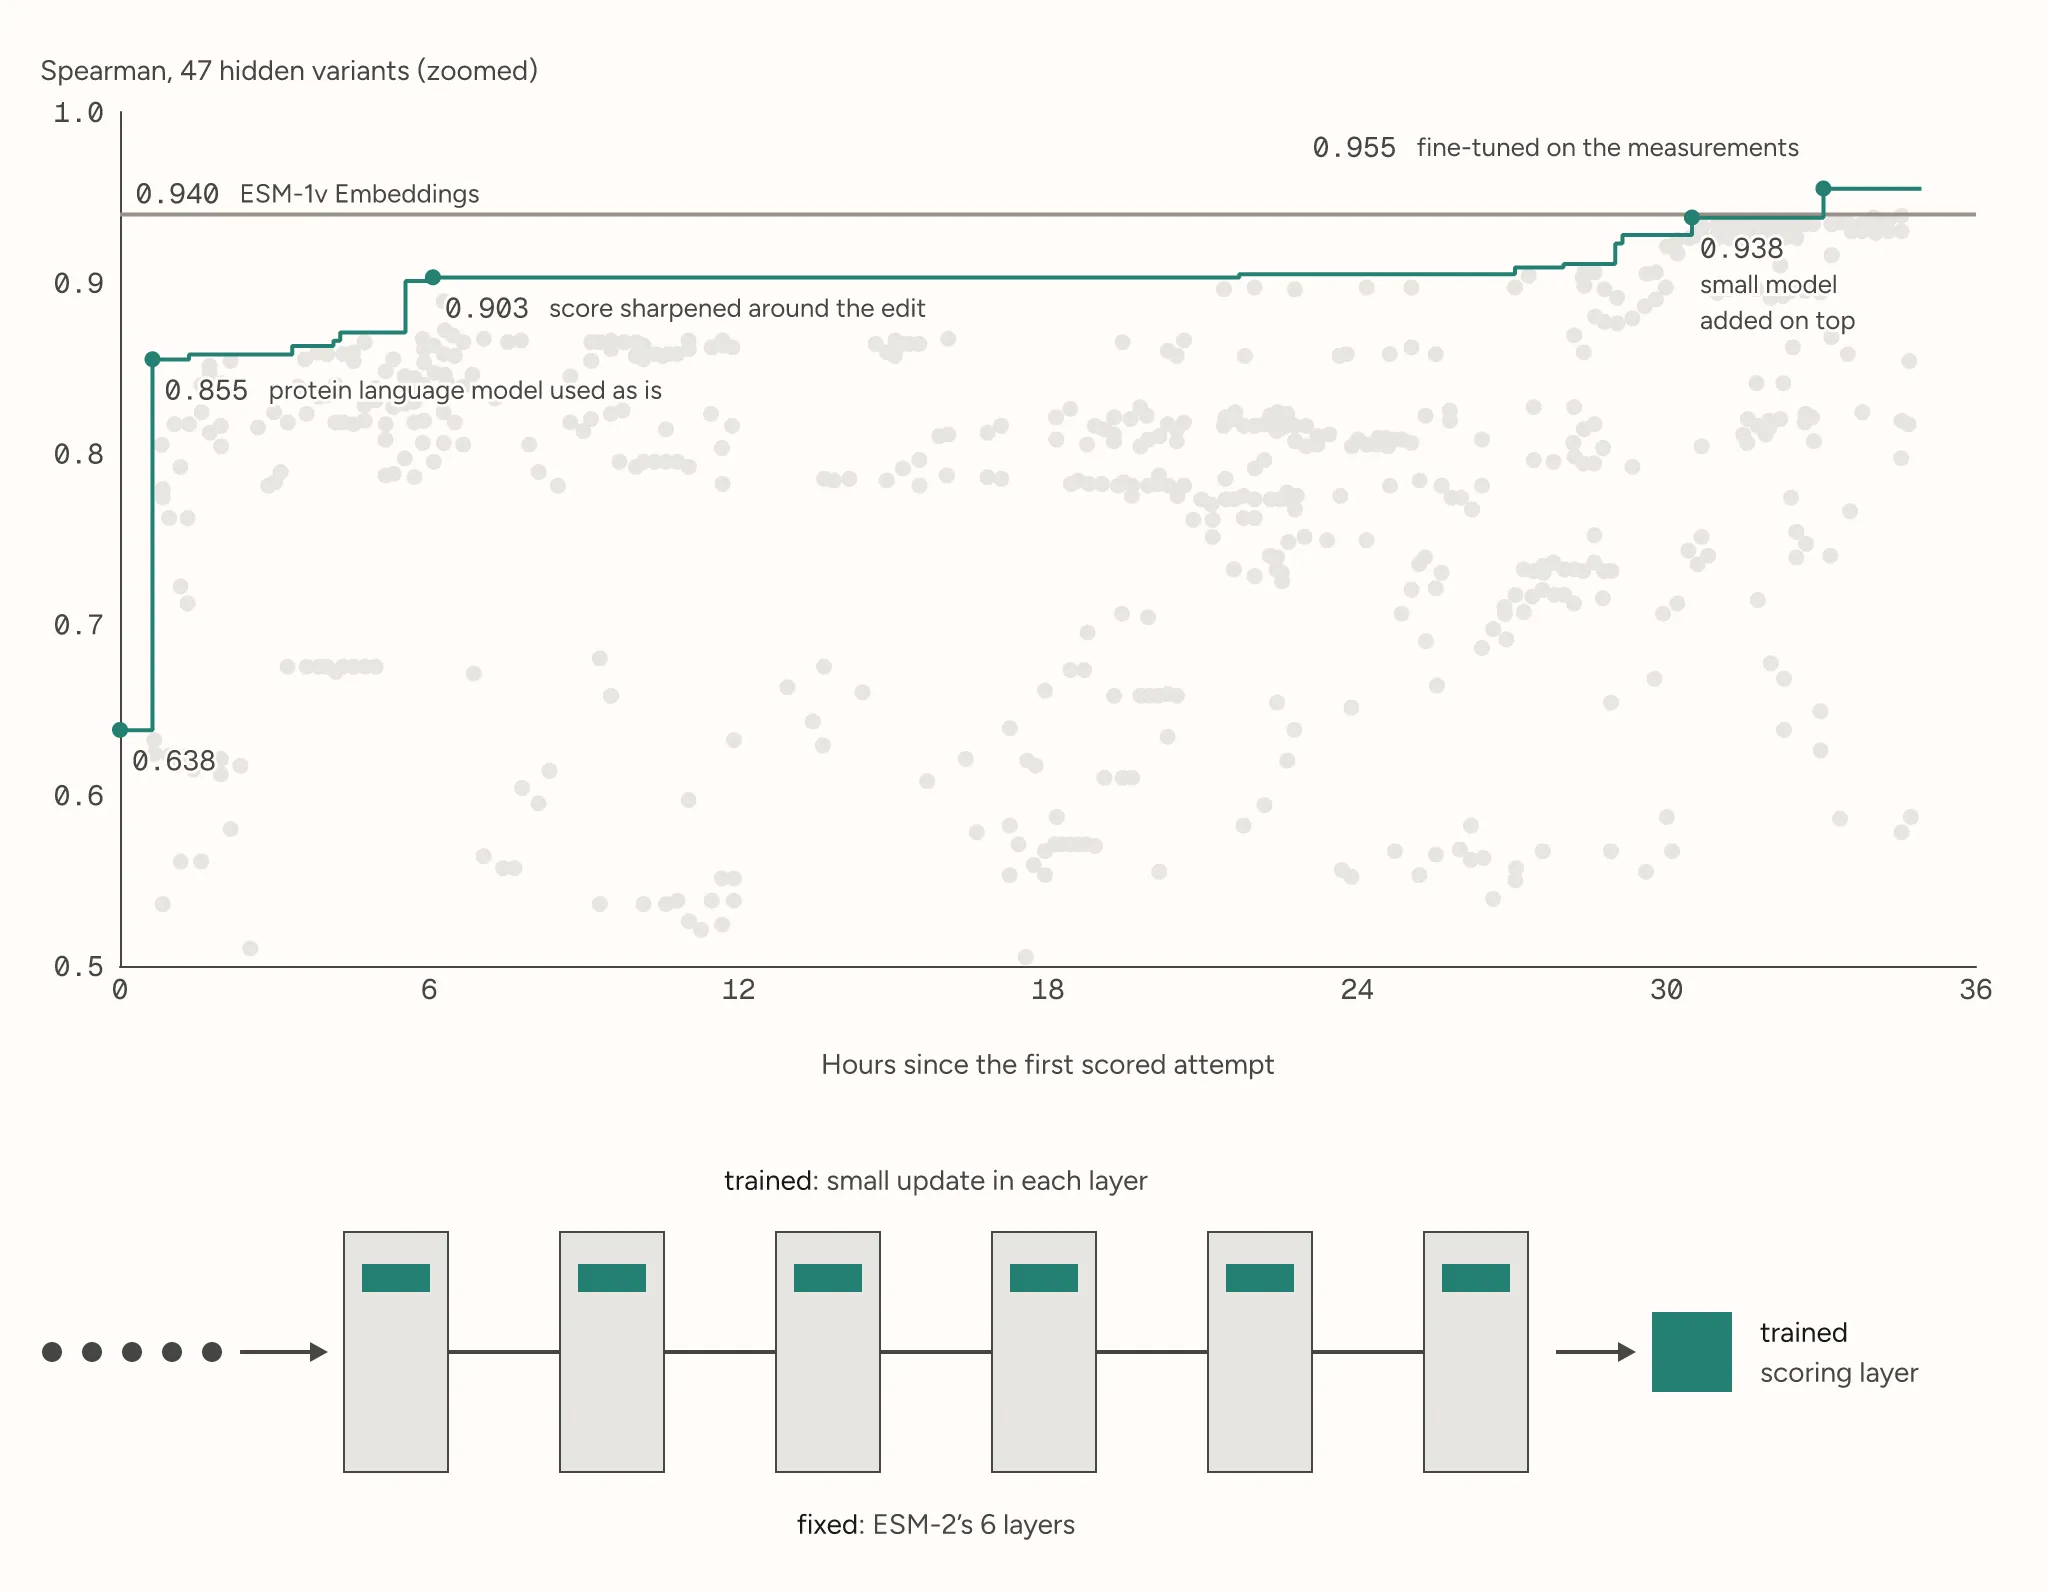
Within two hours, Nextflow Frontier switched to a protein language model trained on millions of natural protein sequences without stability data. It used the model to score how closely each edited sequence resembles natural proteins. Sequences the model scores as less natural usually prove less stable in the laboratory. This approach got 84 of every 100 pairs right. Nextflow Frontier continued testing structure-based approaches, which briefly scored higher. By about 31 hours, its revised language-model approach got about 90 of every 100 pairs right.
About 31 hours in, Nextflow Frontier began fine-tuning a published language model on the stability measurements. It chose the smallest released ESM-2, with 8 million parameters (Lin et al. 2023). Parameters are the adjustable numbers inside a model. Nextflow Frontier kept the original parameters fixed and trained small additions called adapters, along with a final scoring layer. This method is called low-rank adaptation (Hu et al. 2022). Only the additions and scoring layer learned from the 149 measurements. About three hours later, the model ordered about 91 of every 100 pairs correctly, the run’s best result.
How it compares with the published methods
The three published supervised methods keep their language models fixed (Notin et al. 2023b). Each uses a large language model to turn a variant’s sequence into a numerical summary. A small model then learns to predict stability from those summaries. The strongest, which ProteinGym lists as ESM-1v Embeddings, uses ESM-1v, with about 650 million parameters (Meier et al. 2021). The other two use MSA Transformer (Rao et al. 2021) and Tranception (Notin et al. 2022). These language models also read related natural sequences.
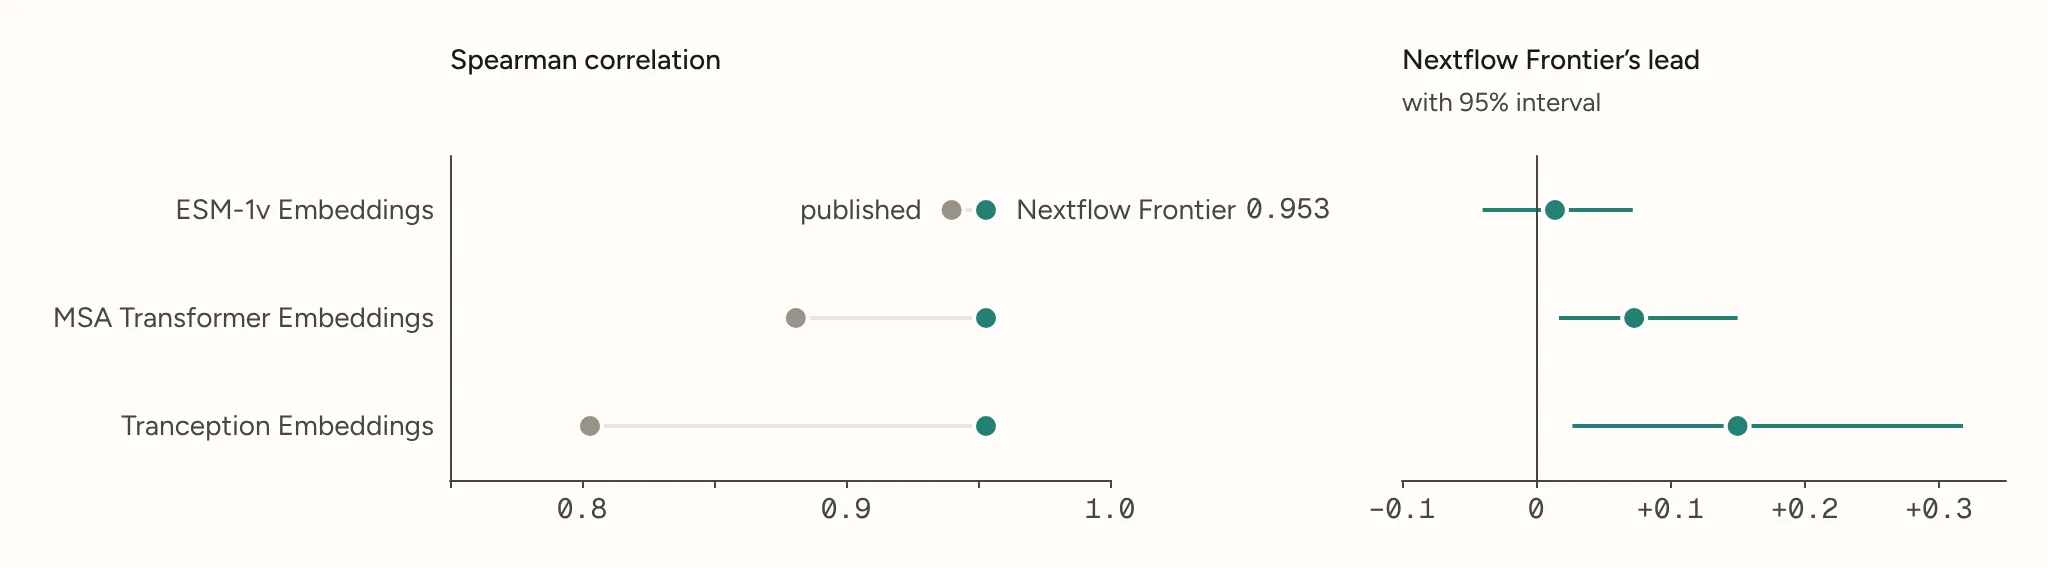
ProteinGym’s leaderboard reports 0.906 for ESM-1v Embeddings. It pools predictions for all 195 published variants into one correlation. That score covers more variants than Nextflow Frontier’s test group. ProteinGym publishes each method’s predictions, so we rescored all three methods on the hidden group.
ESM-1v Embeddings scores 0.940 on that group. Two differences explain the increase from 0.906. First, pooling predictions gives a lower score than averaging the five group correlations, 0.906 against 0.914. Second, the hidden group is one of the easier groups for ESM-1v Embeddings. Its five group scores are 0.94, 0.94, 0.91, 0.90 and 0.88.
One of the 47 hidden variants is the unedited natural protein, which has no published prediction. The matched comparison therefore uses 46 variants. Nextflow Frontier’s model scores 0.953 on those 46 and 0.955 on all 47. ESM-1v Embeddings scores 0.940 on the matched 46.
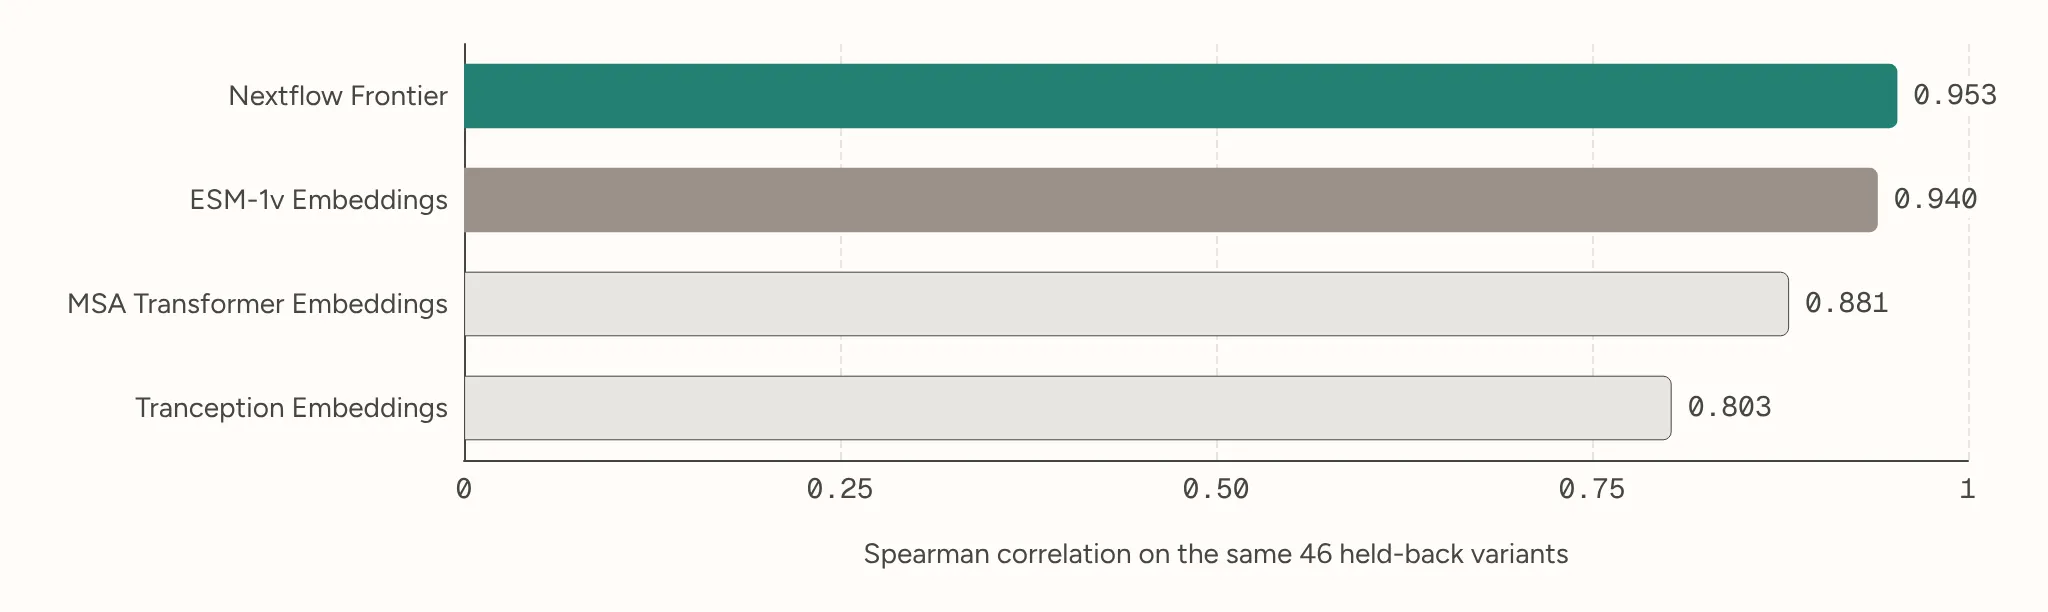
The selected recipe ordered about two more pairs in every 100 correctly than ESM-1v Embeddings. On these 46 variants, the uncertainty interval around that gap includes zero. The observed gaps from the other two comparators were larger (Figure 4).
A much smaller language model
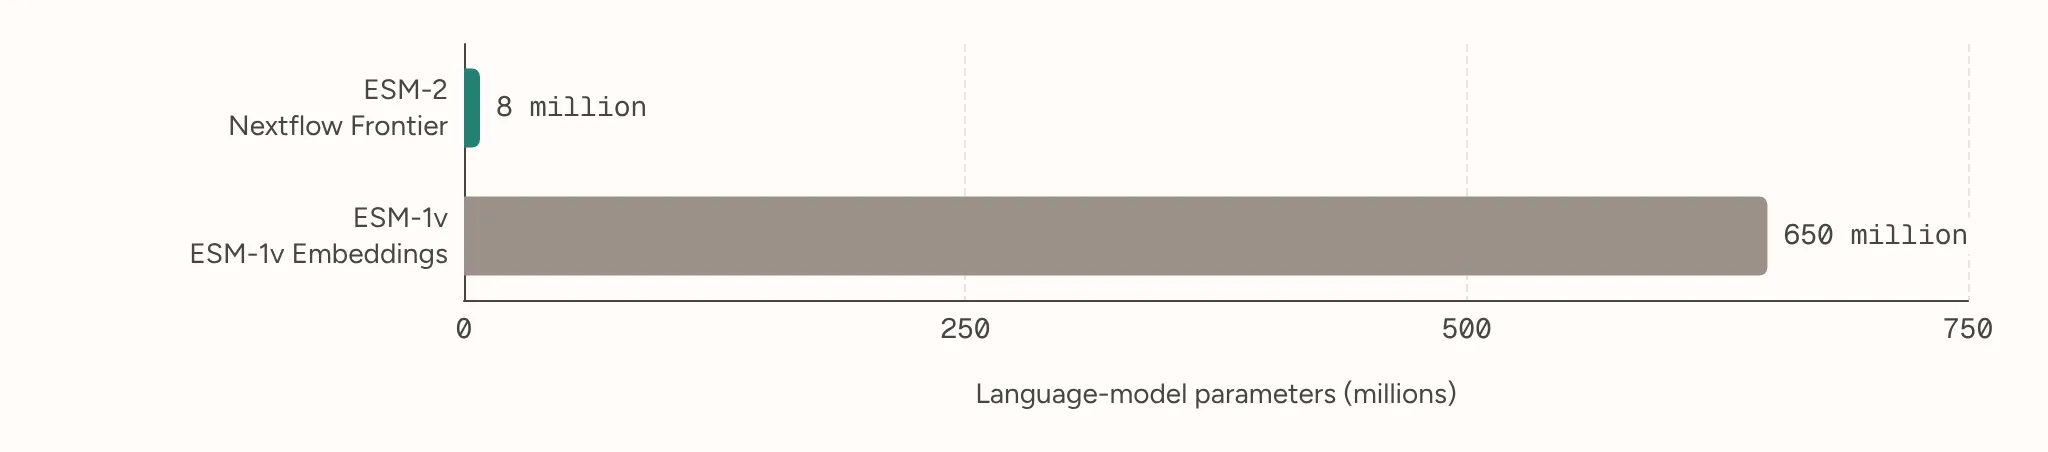
Nextflow Frontier used ESM-2 with 8 million parameters. ESM-1v Embeddings used an ESM-1v checkpoint with about 650 million, around 80 times as many. This compares the language-model components, not measured runtime or cost.
What the result does and does not show
Nextflow Frontier selected the highest-scoring of its 1,012 attempts on the hidden variants and used those same scores to tune the recipe’s training settings. Selecting the best of many scores on a small test tends to overstate performance on new variants. Random starting values also affect training, so the same recipe can score differently each time it trains.
We retrained the selected recipe on the original software with 19 random starting values, the original one and 18 new ones. On the same 46 hidden variants, the scores average 0.934 and range from 0.918 to 0.958, on both sides of ESM-1v Embeddings’ 0.940. Only one start in 19 reaches the selected score of 0.953. The average is about 0.02 lower. The reruns show how much training varies and why the best search score should not be treated as the recipe’s typical performance.
The test covers one domain and one group of 46 hidden variants. We recorded the run on 1 October 2026. It subsequently stopped without producing a better result. This test does not establish performance on other proteins.
The search does not isolate the effect of fine-tuning. The best approaches without it scored 0.939 and 0.938, too close to 0.955 to distinguish. An independent audit found no recorded access to hidden measurements in the evidence it inspected. That finding does not establish complete isolation or remove the effect of repeated test feedback.
What the reruns show
Nextflow Frontier also tried retraining with new starting values, using different training settings that it had not tuned. Those settings scored about 0.82. We therefore reran the selected recipe to test how it performed across starts.
We also tested the recipe under the benchmark’s full protocol. For each start, we trained it five times, holding out a different group each time, and scored all 195 predictions together. Individual starts average 0.894, and 17 of the 19 score below ESM-1v Embeddings’ published 0.906.
Averaging predictions from all 19 starts raises the score to 0.913. The 95 percent range for the difference from ESM-1v Embeddings runs from minus 0.022 to plus 0.036. It includes zero, so the comparison establishes neither a lead nor equivalence. Averaged predictions score slightly above the reference, while individual starts score slightly below on average.
We chose to average predictions after seeing the variation across starts. We fixed that rule before scoring and included every start. The full protocol still includes the hidden group whose scores guided the choice of settings. Training and scoring only on the other four groups leaves that group out of the comparison. It gives 0.903 against 0.899 for ESM-1v Embeddings, again close.
Summary
Nextflow Frontier trained a small protein model that ranked unseen variants correctly in about 91 of every 100 pairs, compared with 89 for ESM-1v Embeddings. Under the benchmark’s five-group protocol, averaging predictions over 19 random starts gives 0.913 against 0.906 on all 195 published variants. The difference is too small to establish a lead. Nextflow Frontier reached these scores with a language model that has about one eightieth as many parameters as ESM-1v.
A lab could try this approach with about 150 measurements from its own protein and use the model to rank length-changing edits before making them at the bench. Testing it on other proteins would show how well it carries over.
Bring Nextflow Frontier a computational problem and a way to evaluate its answers. It can search approaches, run them as reproducible workflows and help you decide which results are worth testing further.
References
- Chen X, Zaro JL, Shen WC (2013). Fusion protein linkers: property, design and functionality. Advanced Drug Delivery Reviews 65, 1357–1369. doi:10.1016/j.addr.2012.09.039
- Hu EJ, Shen Y, Wallis P, et al. (2022). LoRA: low-rank adaptation of large language models. International Conference on Learning Representations (ICLR). arxiv.org/abs/2106.09685
- Lin Z, Akin H, Rao R, et al. (2023). Evolutionary-scale prediction of atomic-level protein structure with a language model. Science 379, 1123–1130. doi:10.1126/science.ade2574
- Lingaraju GM, Bunker RD, Cavadini S, et al. (2014). Crystal structure of the human COP9 signalosome. Nature 512, 161–165. doi:10.1038/nature13566
- Meier J, Rao R, Verkuil R, et al. (2021). Language models enable zero-shot prediction of the effects of mutations on protein function. Advances in Neural Information Processing Systems 34, 29287–29303. proceedings.neurips.cc/paper_files/paper/2021/hash/f51338d736f95dd42427296047067694-Abstract.html
- Notin P, Dias M, Frazer J, et al. (2022). Tranception: protein fitness prediction with autoregressive transformers and inference-time retrieval. Proceedings of the 39th International Conference on Machine Learning, PMLR 162, 16990–17017. proceedings.mlr.press/v162/notin22a
- Notin P, Kollasch AW, Ritter D, et al. (2023a). ProteinGym: large-scale benchmarks for protein fitness prediction and design. Advances in Neural Information Processing Systems 36 (Datasets and Benchmarks Track), 64331–64379. proceedings.neurips.cc/paper_files/paper/2023/hash/cac723e5ff29f65e3fcbb0739ae91bee-Abstract.html
- Notin P, Weitzman R, Marks D, et al. (2023b). ProteinNPT: improving protein property prediction and design with non-parametric transformers. Advances in Neural Information Processing Systems 36, 33529–33563. proceedings.neurips.cc/paper_files/paper/2023/hash/6a4d5d85f7a52f062d23d98d544a5578-Abstract-Conference.html
- Pace CN, Fu H, Fryar KL, et al. (2011). Contribution of hydrophobic interactions to protein stability. Journal of Molecular Biology 408, 514–528. doi:10.1016/j.jmb.2011.02.053
- Rao RM, Liu J, Verkuil R, et al. (2021). MSA Transformer. Proceedings of the 38th International Conference on Machine Learning, PMLR 139, 8844–8856. proceedings.mlr.press/v139/rao21a
- Savino S, Desmet T, Franceus J (2022). Insertions and deletions in protein evolution and engineering. Biotechnology Advances 60, 108010. doi:10.1016/j.biotechadv.2022.108010
- Tsuboyama K, Dauparas J, Chen J, et al. (2023). Mega-scale experimental analysis of protein folding stability in biology and design. Nature 620, 434–444. doi:10.1038/s41586-023-06328-6
- Wei N, Deng XW (2003). The COP9 signalosome. Annual Review of Cell and Developmental Biology 19, 261–286. doi:10.1146/annurev.cellbio.19.111301.112449
Interested in Nextflow Frontier?
Nextflow Frontier is a closed-loop discovery system built on Nextflow. It designs computational experiments, runs each one as a reproducible pipeline and learns from every result’s score what to try next, under the supervision of scientists.

Filed under Protein engineering
All posts