All posts
#1 BenchmarkDrug discovery · 11 min read
Simple models rival a billion-parameter neural network in an EGFR binding assay
By Edmund Miller and Harshil Patel
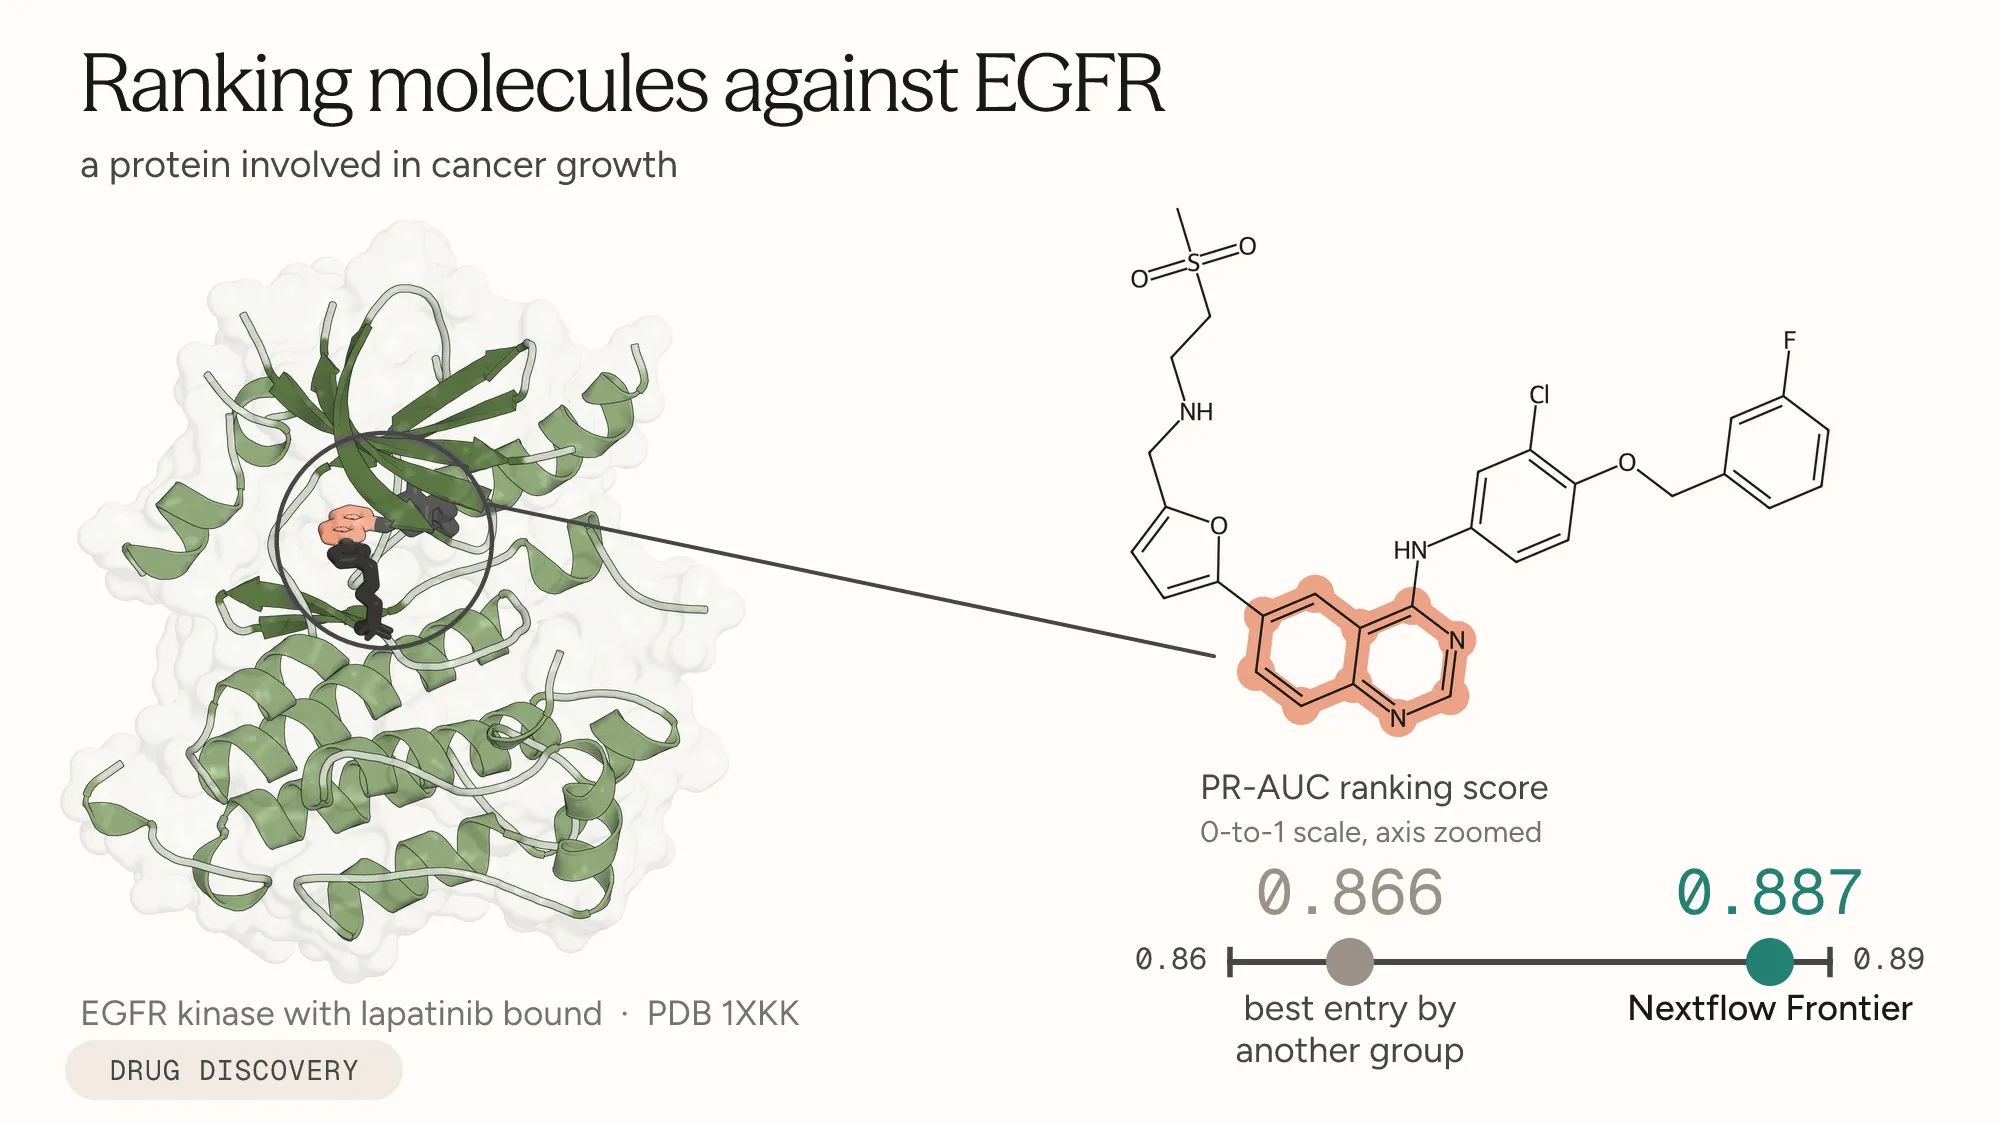
Nextflow Frontier combined two small chemistry models to rank 144 molecules for binding to EGFR, a protein that some cancer drugs target. The selected ranking scored 0.887 on Polaris's 0-to-1 PR-AUC scale, against 0.866 for the best entry by another group, a billion-parameter neural network. Both small models train and run in seconds on a laptop. The result gives chemistry teams a compact approach to try on their own molecules, with a fresh comparison needed to test how well it carries over.
We used Nextflow Frontier to rank molecules by how likely they are to bind EGFR, a protein behind some lung cancers (Yun et al. 2007). Nextflow Frontier proposes models, runs them and uses their scores to decide what to try next. It produced two logistic regressions, among the simplest prediction models in chemistry. Each scores a molecule by adding up weights for the chemical fragments it contains. Those weights give chemists a way to inspect which fragment features contribute to a molecule’s score. Both models train and run in seconds without special hardware. The reference network has a billion parameters, the adjustable numbers a model learns, and was trained on specialist graphics chips.
Why rank molecules for EGFR
A drug discovery team can make or buy far more molecules than it can afford to test, and most of them do nothing to any given protein. The order of testing therefore decides how quickly the team finds the few that work and how much of its budget goes on failures.
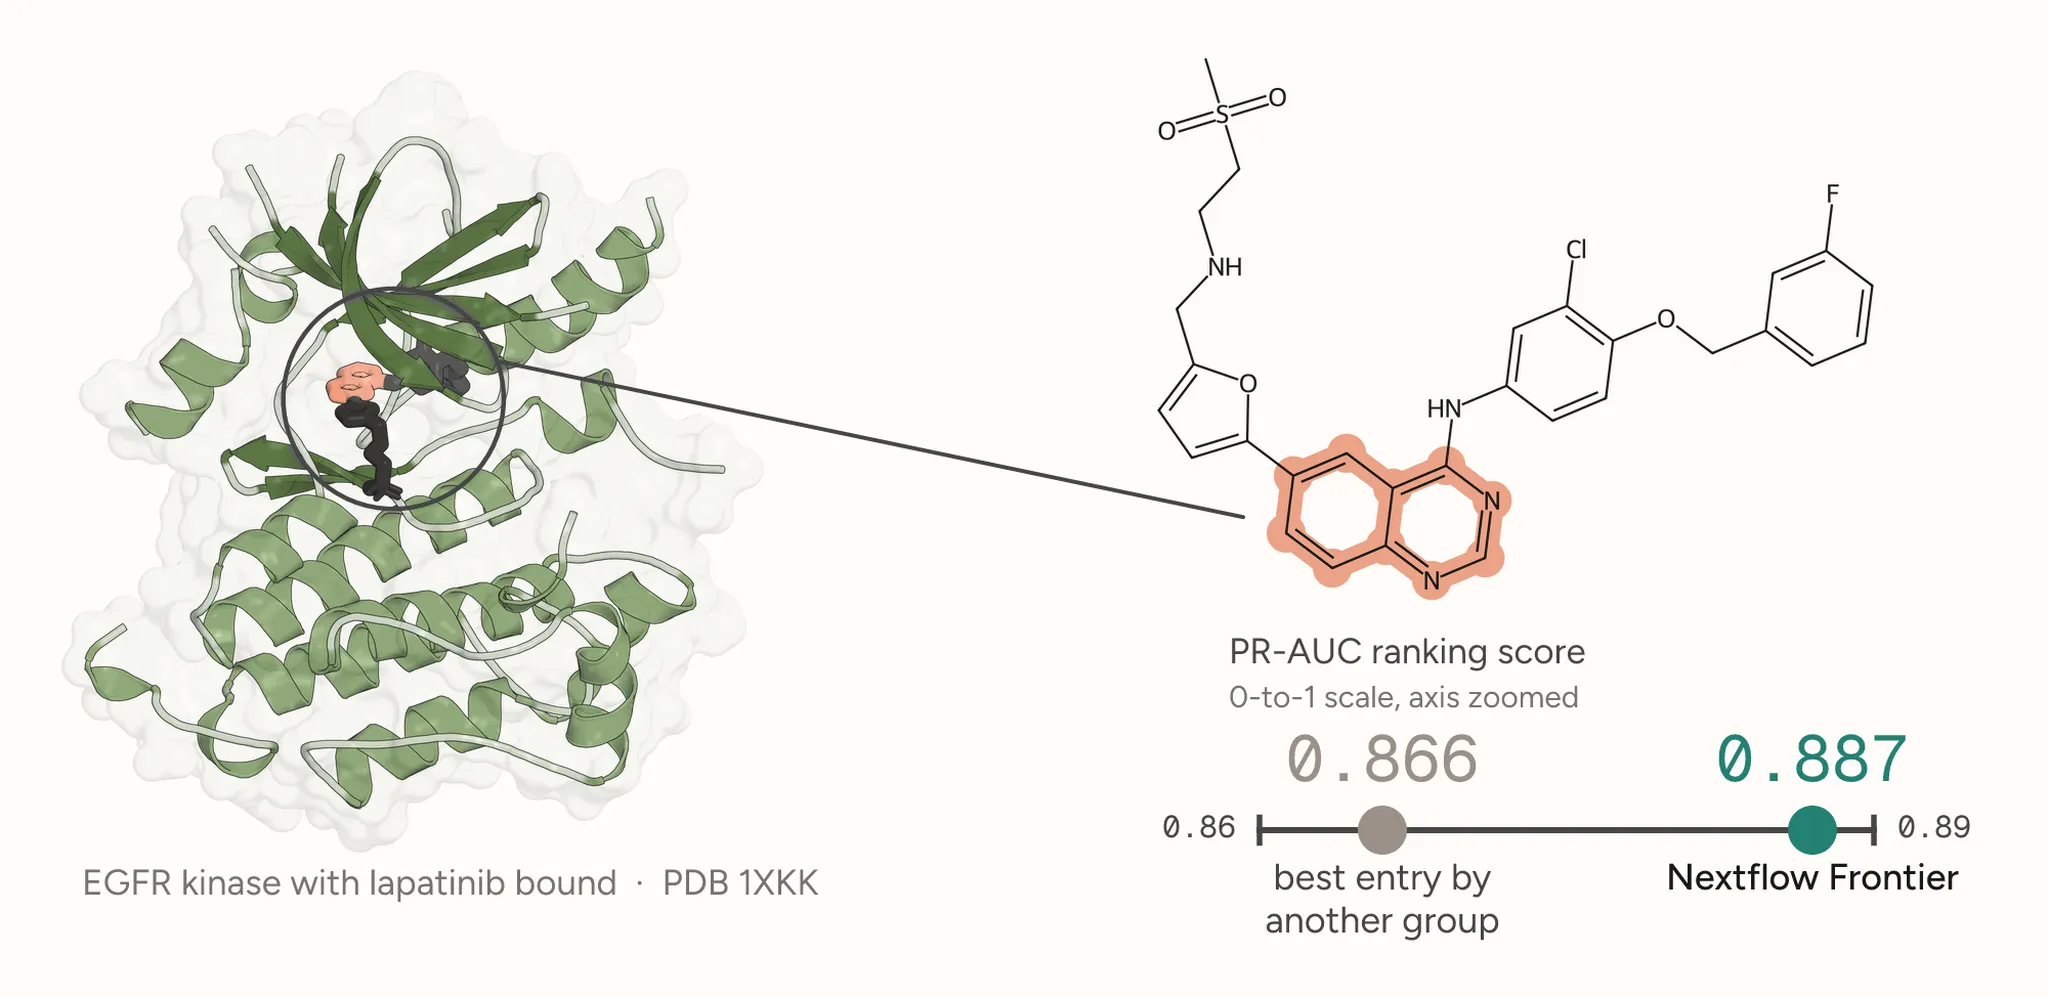
EGFR sits in the membrane that encloses the cell. When a growth factor binds to its outer part, it relays a signal into the cell telling it to grow and divide (Yun et al. 2007). The part inside the cell is an enzyme that uses the cell’s energy-carrying molecule, ATP, to attach phosphate groups to other proteins and pass the signal onward. Enzymes that do this are called kinases. Mutations that leave EGFR switched on drive some lung cancers, and several approved drugs work by filling the pocket where ATP would bind (Yun et al. 2007). Lapatinib, a breast cancer drug that blocks both EGFR and its close relative HER2, is one of them (Ryan et al. 2008; Wood et al. 2004; Figure 1).
The test
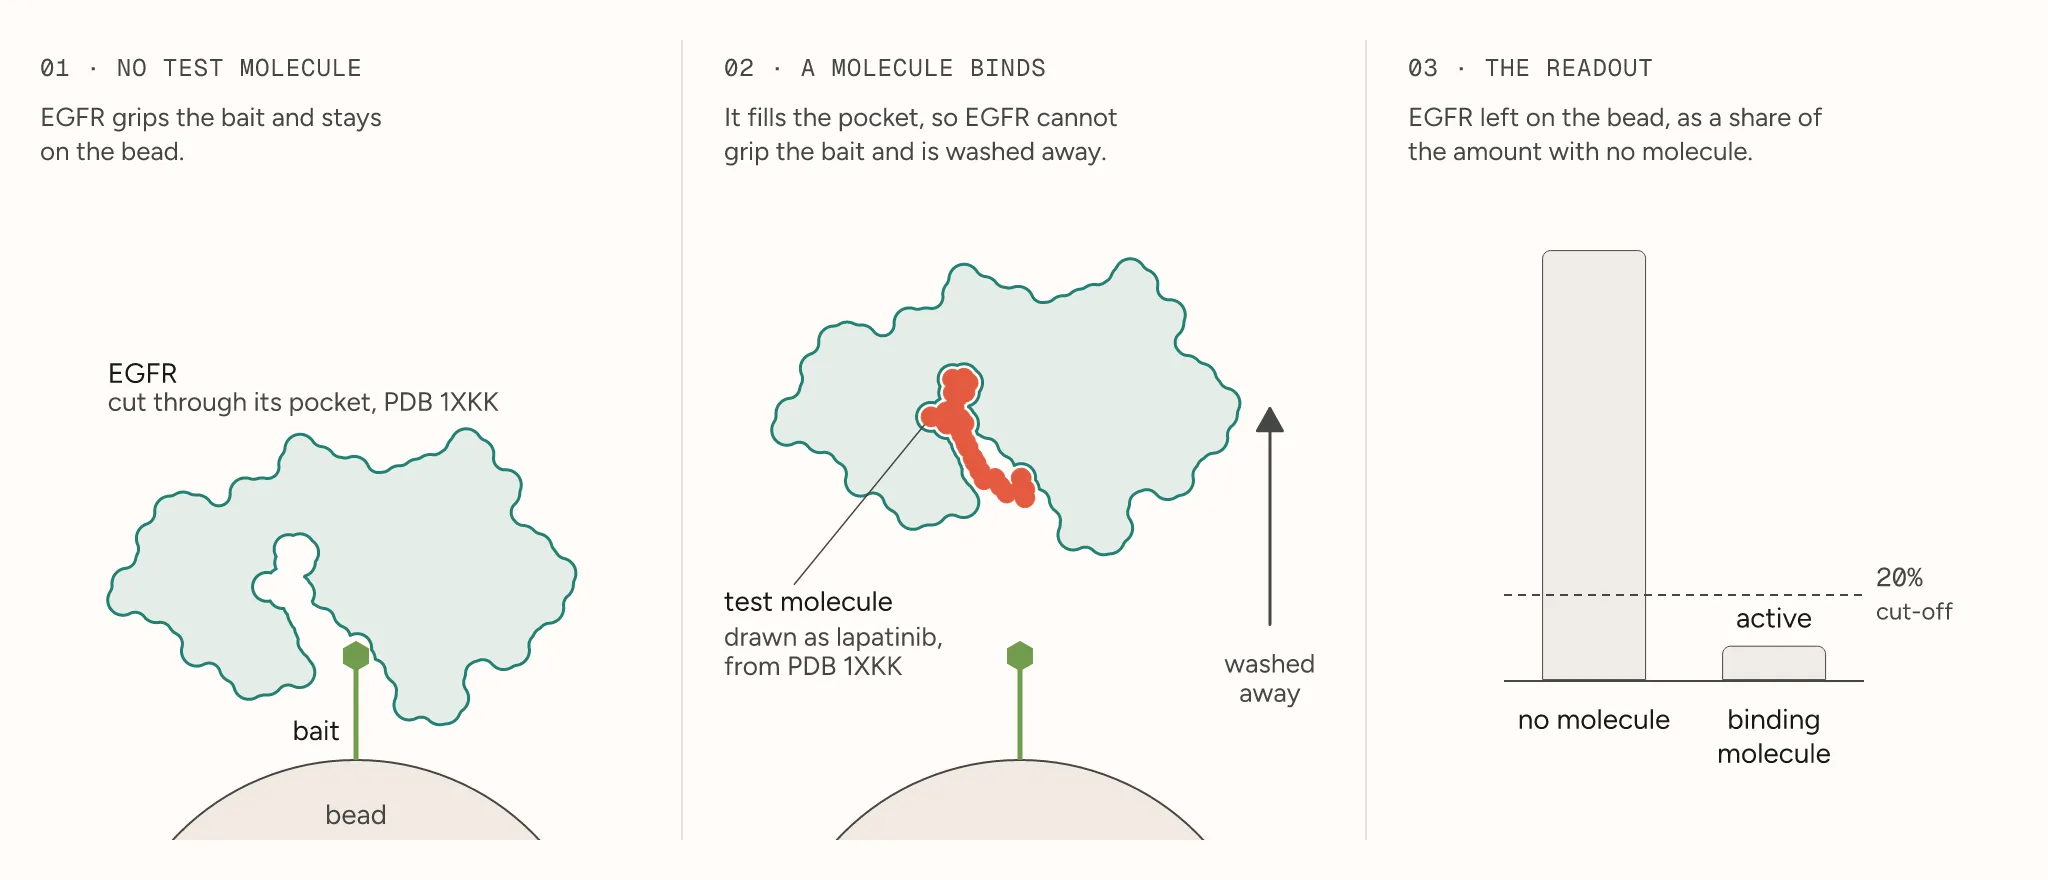
Polaris built this test from a set of 645 molecules made to block kinases, released by GSK, Takeda and Pfizer for open research as PKIS2 (Drewry et al. 2017), and uses 640 of them. Each molecule was tested once, at 1 µM (one micromole per liter), in a competition binding assay against the unmutated (wild-type) form of EGFR, not the mutated form found in those lung cancers. In this assay, a molecule that occupies EGFR’s pocket stops EGFR gripping a bait fixed to a bead. Polaris calls a molecule active when it pushed more than 80% of the EGFR off the bait, compared with no molecule (Polaris 2026; Figure 2).
The benchmark gives every entrant 496 molecules with a yes-or-no label. Only 50 are active. It asks for a ranking of 144 other molecules whose labels stay hidden. Polaris divided the molecules by scaffold, the core framework of rings and linkers that defines a chemical family. None of the 74 test scaffolds appears in the training set. Molecules on the two sides can still share a smaller core, including lapatinib’s two-ring quinazoline shown in Figure 1. The test asks how well a model ranks molecules with scaffolds it has never seen.
Polaris scores each ranking with PR-AUC, short for the area under the precision-recall curve, a measure of how cleanly the active molecules come first. It runs from 0 to 1, where 1 means every active molecule comes before every inactive one. Imagine testing the molecules in the ranked order and, each time an active one turns up, noting what share of the molecules tested so far were active. PR-AUC is the average of those shares, so a score near 0.89 means that, on average, about nine in ten of the molecules tested up to each active one were active too. It scores the order of the list, not the share of predictions that were right. A ranking in random order would score about the share of the molecules that are active: the weakest entries on the leaderboard, which order the molecules no better than chance, score 0.11.
The best entry by another group is built on MolGPS, a graph neural network, which reads a molecule as atoms joined by bonds and, layer by layer, lets each atom gather information from its neighbors. Its developers first trained it on the largest public collection of molecular graphs, about five million molecules, to learn general chemistry, and the entry uses a version with about a billion parameters (Sypetkowski et al. 2024).
How Nextflow Frontier built its models
Over 80 hours Nextflow Frontier made 820 scored attempts across 84 approaches, each run with particular settings. It read the scores and its own written notes to decide what to try next. That search led it to change how it described molecules and how it combined the models (Figure 3).
Early on, Nextflow Frontier’s strongest models were logistic regressions reading tallies of the small fragments in a molecule, called chemical fingerprints, where each fragment is an atom together with its neighbors up to two bonds away.
Nextflow Frontier’s notes then turned to how EGFR drugs bind. These drugs form hydrogen bonds, weak attractions involving a hydrogen atom, with the hinge between the kinase’s two lobes. The hinge lines the ATP pocket (Yun et al. 2007). The notes proposed describing atoms by their binding roles rather than their elements. Nextflow Frontier described each atom by roles such as giving or accepting a hydrogen bond or carrying a charge. The recorded PR-AUC on the 144 test molecules rose from 0.848 for the element-based version to 0.863. Letting each fragment reach three bonds out instead of two gave 0.864. These search observations do not isolate which change caused an improvement.
Further tweaks to that model gave only small gains, so Nextflow Frontier changed direction and started a fresh line of work with a different fingerprint, one that lists the chains of atoms and the ring systems in a molecule. On its own that model scored 0.876. (Chemists call the atom-roles description an FCFP fingerprint and the chains-and-rings one an Avalon fingerprint.)
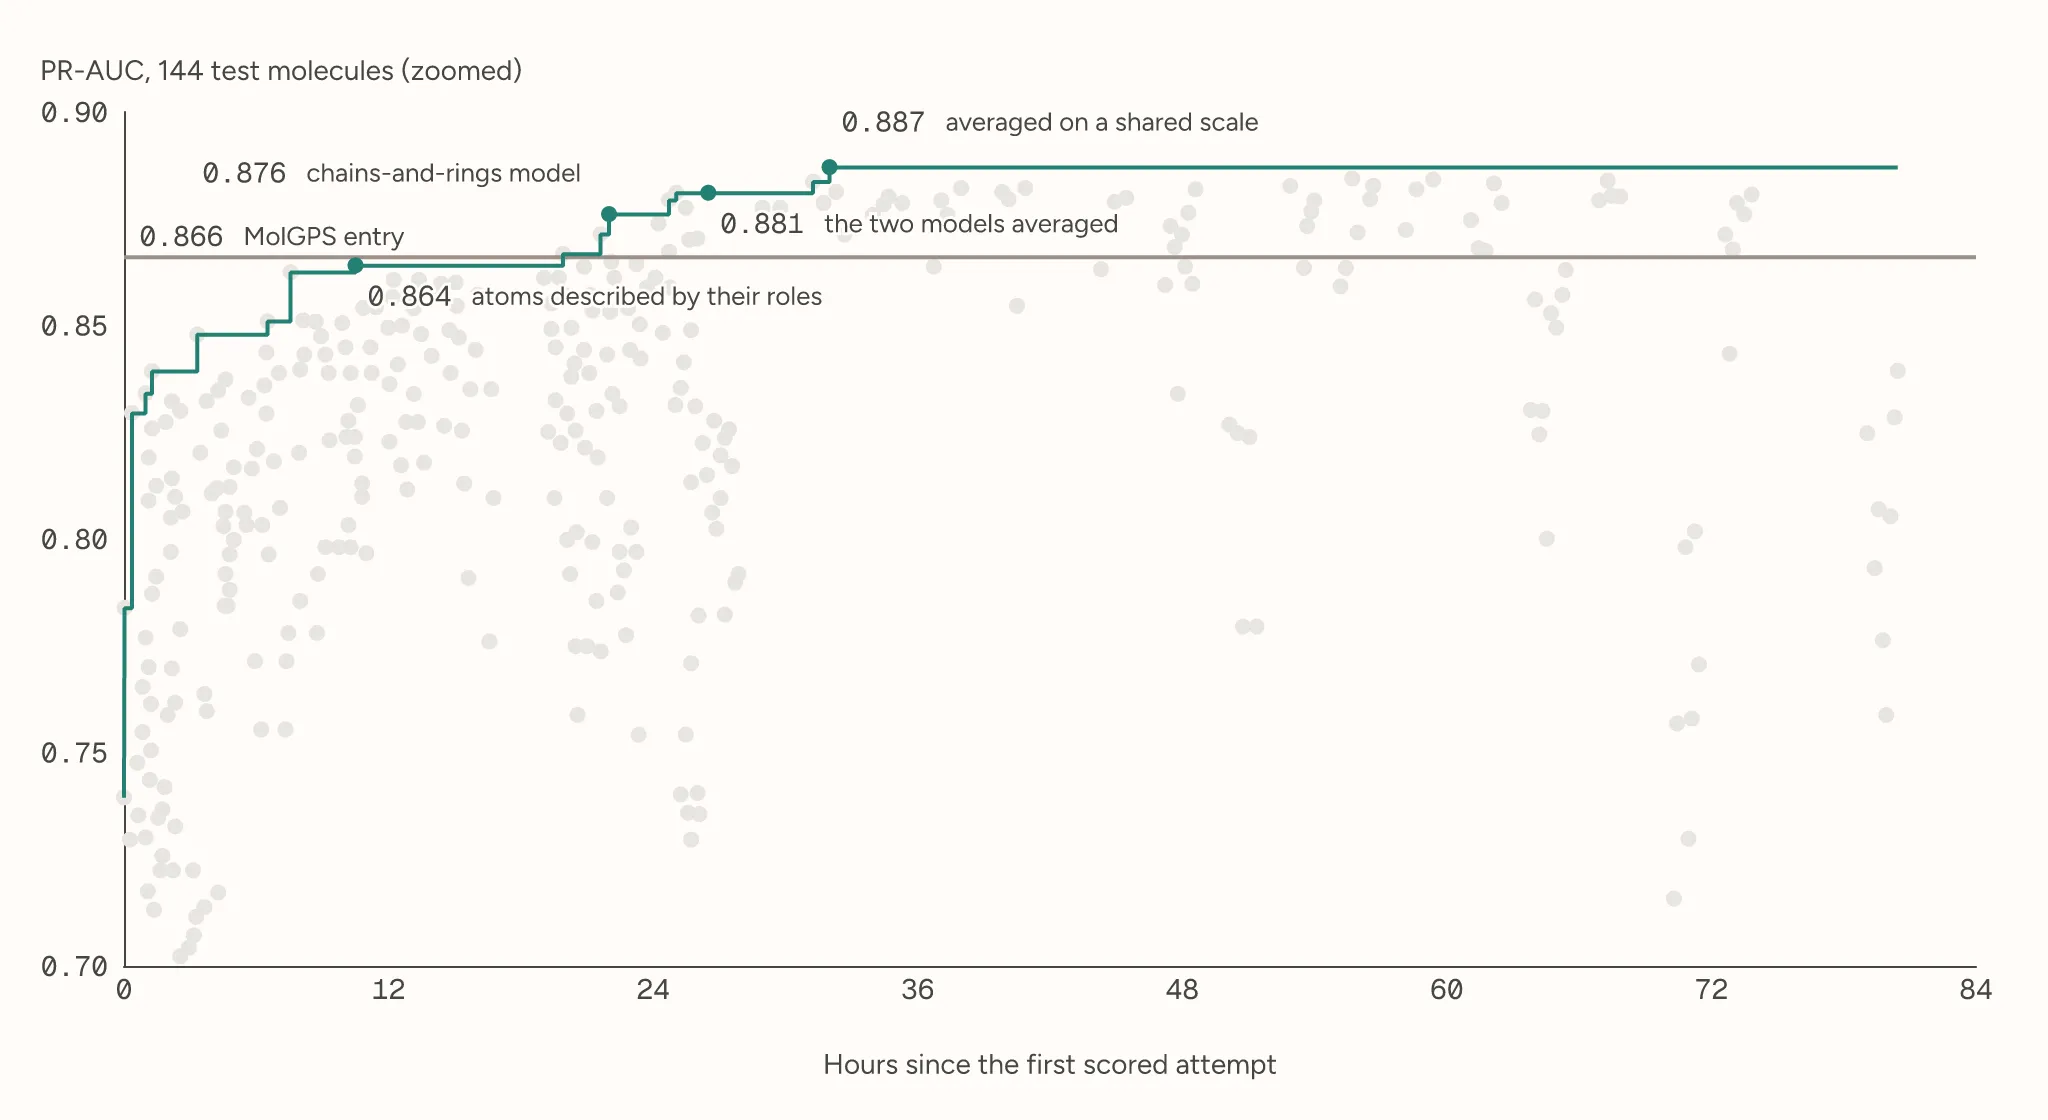
Nextflow Frontier then combined the two models. A weighted average of their predicted chances of activity scored 0.881. Its notes identified a possible weakness. The atom-roles model’s predictions occupied a narrow band, while the other model’s spread widely and could dominate the average near the top of the list. Citing Genest and Zidek’s 1986 review of methods for combining forecasts, Nextflow Frontier proposed averaging the predictions on the log-odds scale. This is the logarithm of the odds that a molecule is active. The best recorded score rose to 0.887, with a fifth of the weight on the chains-and-rings model. The increase of 0.006 on 144 molecules cannot be distinguished from chance.
How the two scores compare
On the same 144 test molecules, Nextflow Frontier’s selected attempt scored 0.887 on PR-AUC against 0.866 for the MolGPS reference entry. To picture a gap of 0.021, take a made-up list of 144 molecules, 14 of them active (about one in ten, as in the training molecules), ranked well enough to score about 0.9. Moving a single inactive molecule up into tenth place in that list lowers the score by 0.022, about the size of the gap. This example shows how one change in the order can move the score by about the size of the observed gap. It does not translate that gap into a fixed number of laboratory tests. Polaris also publishes a second ranking measure, ROC-AUC, the chance that an active molecule is ranked above an inactive one picked at random. On that measure Nextflow Frontier’s ranking scores 0.934 and that entry 0.961, a difference of about the same size in the other direction, and just as unresolved. PR-AUC emphasizes concentrating active molecules near the top of the list, while ROC-AUC measures how often an active molecule ranks above an inactive one across the list.
The two small models scored in the same range as a billion-parameter network on chemical families held back from training. This does not settle which ranking is better. Polaris publishes neither uncertainty estimates for its entries nor the reference entry’s predictions for individual molecules. We therefore cannot compare the rankings molecule by molecule. Resampling the 144 test molecules gives Nextflow Frontier’s score a range of roughly 0.73 to 0.99. That range includes the reference score of 0.866.
The search selected 0.887 as the best of 820 scores on these same molecules. Choosing the best of many scores on one test tends to overstate performance on new molecules. To estimate that effect, we selected the best attempt again on resampled sets and scored it on the molecules left out. This analysis estimates the recipe’s score on new molecules at about 0.80 to 0.86, against the reference entry’s 0.866 on the original test.
Nextflow Frontier’s 0.887 has since been posted to the Polaris leaderboard, where it ranks first. The entry discloses that scores on these same molecules guided selection.
What this does not show
The result covers one protein in its unmutated form, one laboratory measurement made once at one concentration, and 144 molecules with yes-or-no labels. A high rank means the models expect a molecule to push EGFR off the bait in a test tube. It does not show that the molecule stops cancer cells growing, works in a patient or spares related proteins such as HER2. Sparing related proteins is called selectivity. Whether the same recipe works for another protein is untested.
The fragment weights show how the models calculate a score. They do not by themselves explain why a molecule binds EGFR. A fingerprint position can also represent more than one fragment, so interpreting a weight requires checking which fragments it represents.
Audit records covering 22,443 tool calls and 115,837 files show no access to the hidden labels, which reached Nextflow Frontier only through each attempt’s score. The run’s permissions would have allowed access, so these records show that access did not happen, not that it was prevented. That limit and the use of repeated test scores are reasons to compare the fixed recipe on newly measured molecules.
What would change if it holds
To settle the comparison, fix Nextflow Frontier’s recipe and run it alongside the MolGPS reference method on newly measured molecules from chemical families neither method has seen. Compare their rankings molecule by molecule and estimate the uncertainty in the difference. If the simple models keep pace, a chemistry team could use them in-house to rank its EGFR candidates and send the top of the list to the laboratory first. The team could also investigate how the models’ fragment weights affect that order. This could reduce the cost of building shortlists and help explain why a molecule was chosen.
Summary
Nextflow Frontier built a compact EGFR ranking recipe from two familiar chemistry models. Its selected ranking scored 0.887 on PR-AUC, against 0.866 for the billion-parameter MolGPS reference entry. On ROC-AUC, the order reversed, with Nextflow Frontier at 0.934 and the reference at 0.961. The search explored atom roles, chains and rings, and ways to combine their predictions. The resulting models run on a laptop and expose the fragment weights behind each score. A comparison on newly measured molecules would test whether this recipe can help chemists choose which EGFR candidates to send to the laboratory first.
Bring Nextflow Frontier a defined computational task and a way to evaluate its answers. It searches for candidate workflows and reports their measured results.
References
- Drewry DH, Wells CI, Andrews DM, et al. (2017). Progress towards a public chemogenomic set for protein kinases and a call for contributions. PLOS ONE 12(8): e0181585. doi:10.1371/journal.pone.0181585
- Genest C, Zidek JV (1986). Combining probability distributions: a critique and an annotated bibliography. Statistical Science 1(1): 114–135. doi:10.1214/ss/1177013825
- Polaris (2026). Benchmark pkis2-egfr-wt-c-1: task, scaffold split, PR-AUC and leaderboard. polarishub.io/benchmarks/polaris/pkis2-egfr-wt-c-1 (accessed 8 October 2026; Nextflow Frontier’s own 0.887 entry was added on 9 October 2026).
- RCSB Protein Data Bank (2026). Entry 1XKK: EGFR kinase domain complexed with a quinazoline inhibitor - GW572016 (lapatinib). rcsb.org/structure/1XKK (accessed 9 October 2026).
- Ryan Q, Ibrahim A, Cohen MH, et al. (2008). FDA drug approval summary: lapatinib in combination with capecitabine for previously treated metastatic breast cancer that overexpresses HER-2. The Oncologist 13(10): 1114–1119. doi:10.1634/theoncologist.2008-0816
- Sypetkowski M, Wenkel F, Poursafaei F, et al. (2024). On the scalability of GNNs for molecular graphs. arXiv:2404.11568. arxiv.org/abs/2404.11568
- Wood ER, Truesdale AT, McDonald OB, et al. (2004). A unique structure for epidermal growth factor receptor bound to GW572016 (lapatinib): relationships among protein conformation, inhibitor off-rate, and receptor activity in tumor cells. Cancer Research 64(18): 6652–6659. doi:10.1158/0008-5472.CAN-04-1168
- Yun CH, Boggon TJ, Li Y, et al. (2007). Structures of lung cancer-derived EGFR mutants and inhibitor complexes: mechanism of activation and insights into differential inhibitor sensitivity. Cancer Cell 11(3): 217–227. doi:10.1016/j.ccr.2006.12.017
Interested in Nextflow Frontier?
Nextflow Frontier is a closed-loop discovery system built on Nextflow. It designs computational experiments, runs each one as a reproducible pipeline and learns from every result’s score what to try next, under the supervision of scientists.

Filed under Drug discovery
All posts