All posts
#4 BenchmarkSingle-cell omics · 11 min read
Nextflow Frontier named kidney cells more accurately than published methods
By Edmund Miller and Harshil Patel
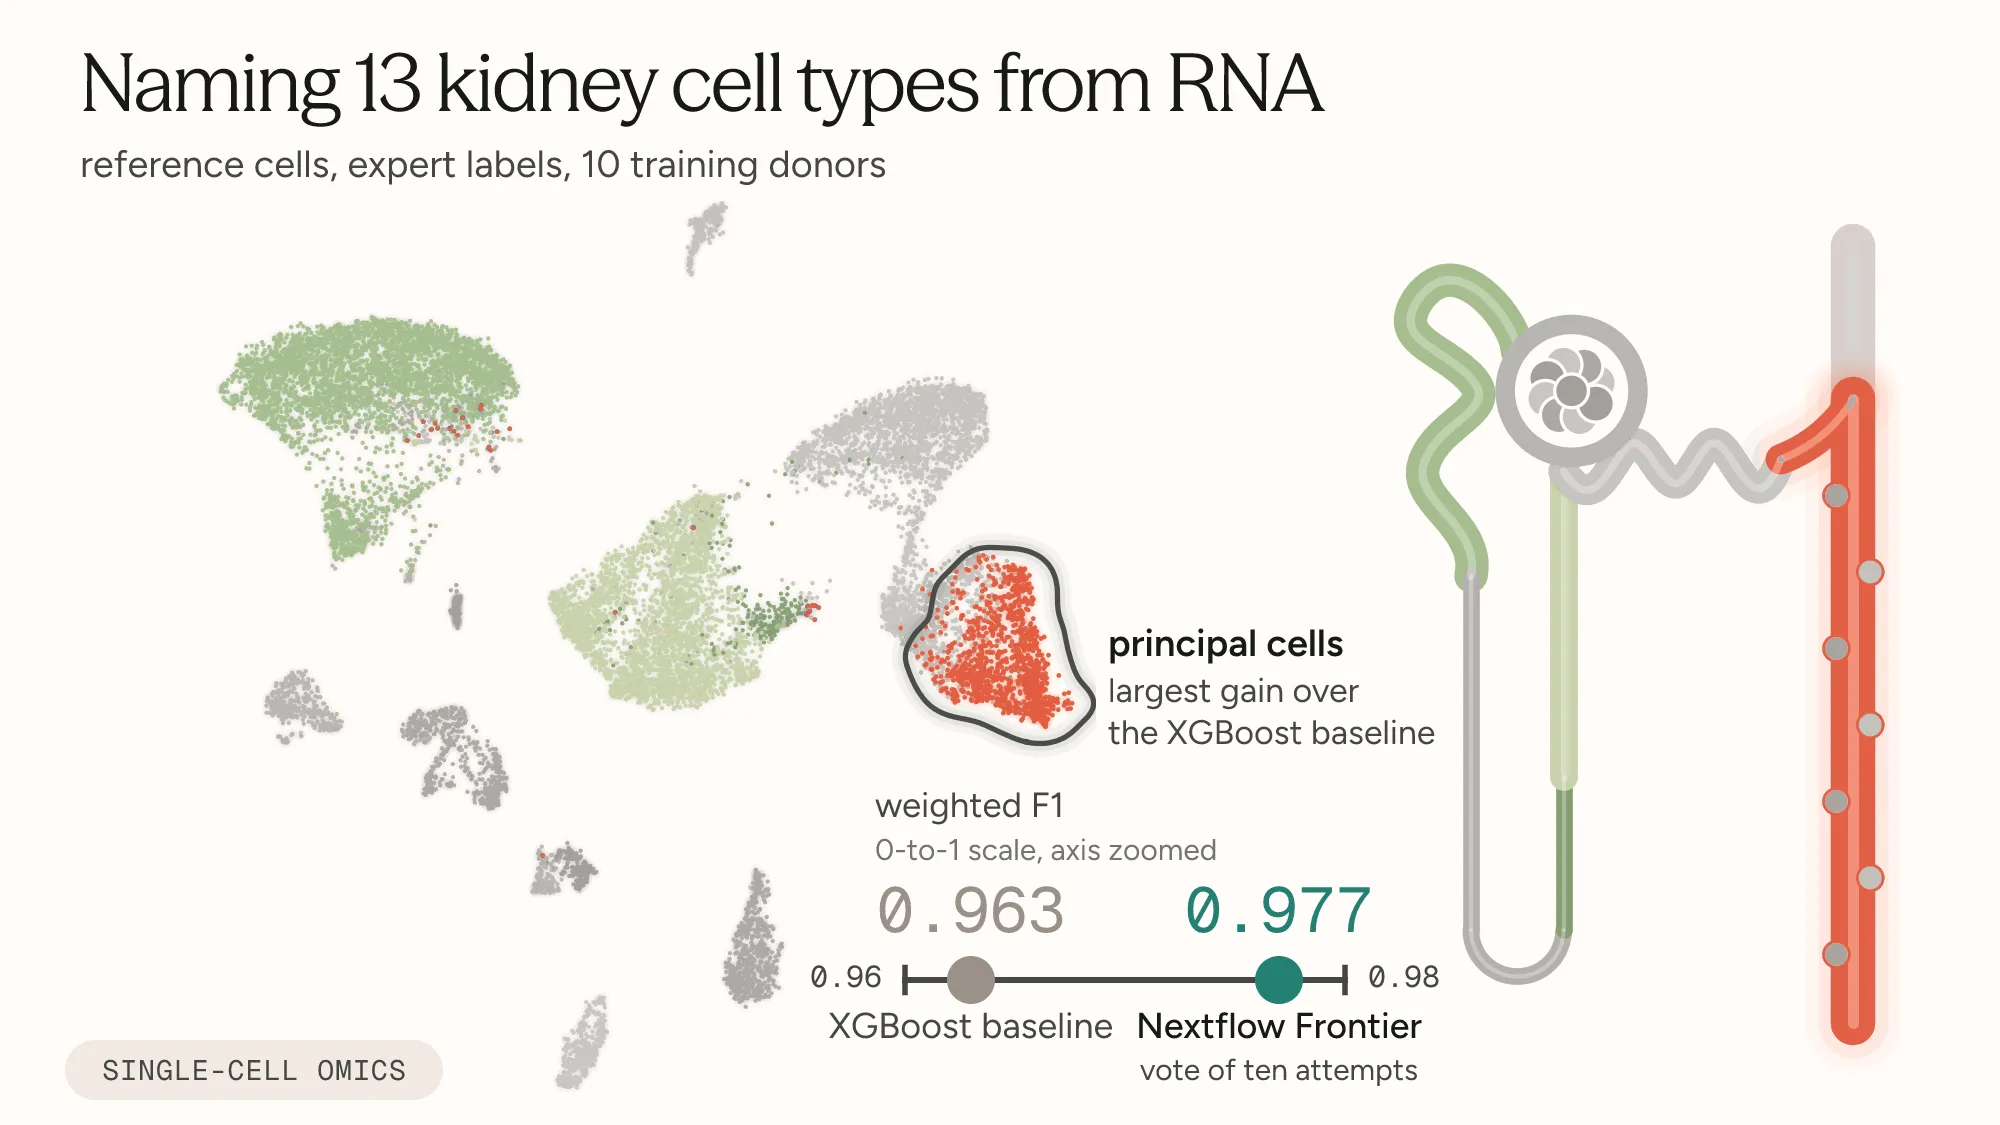
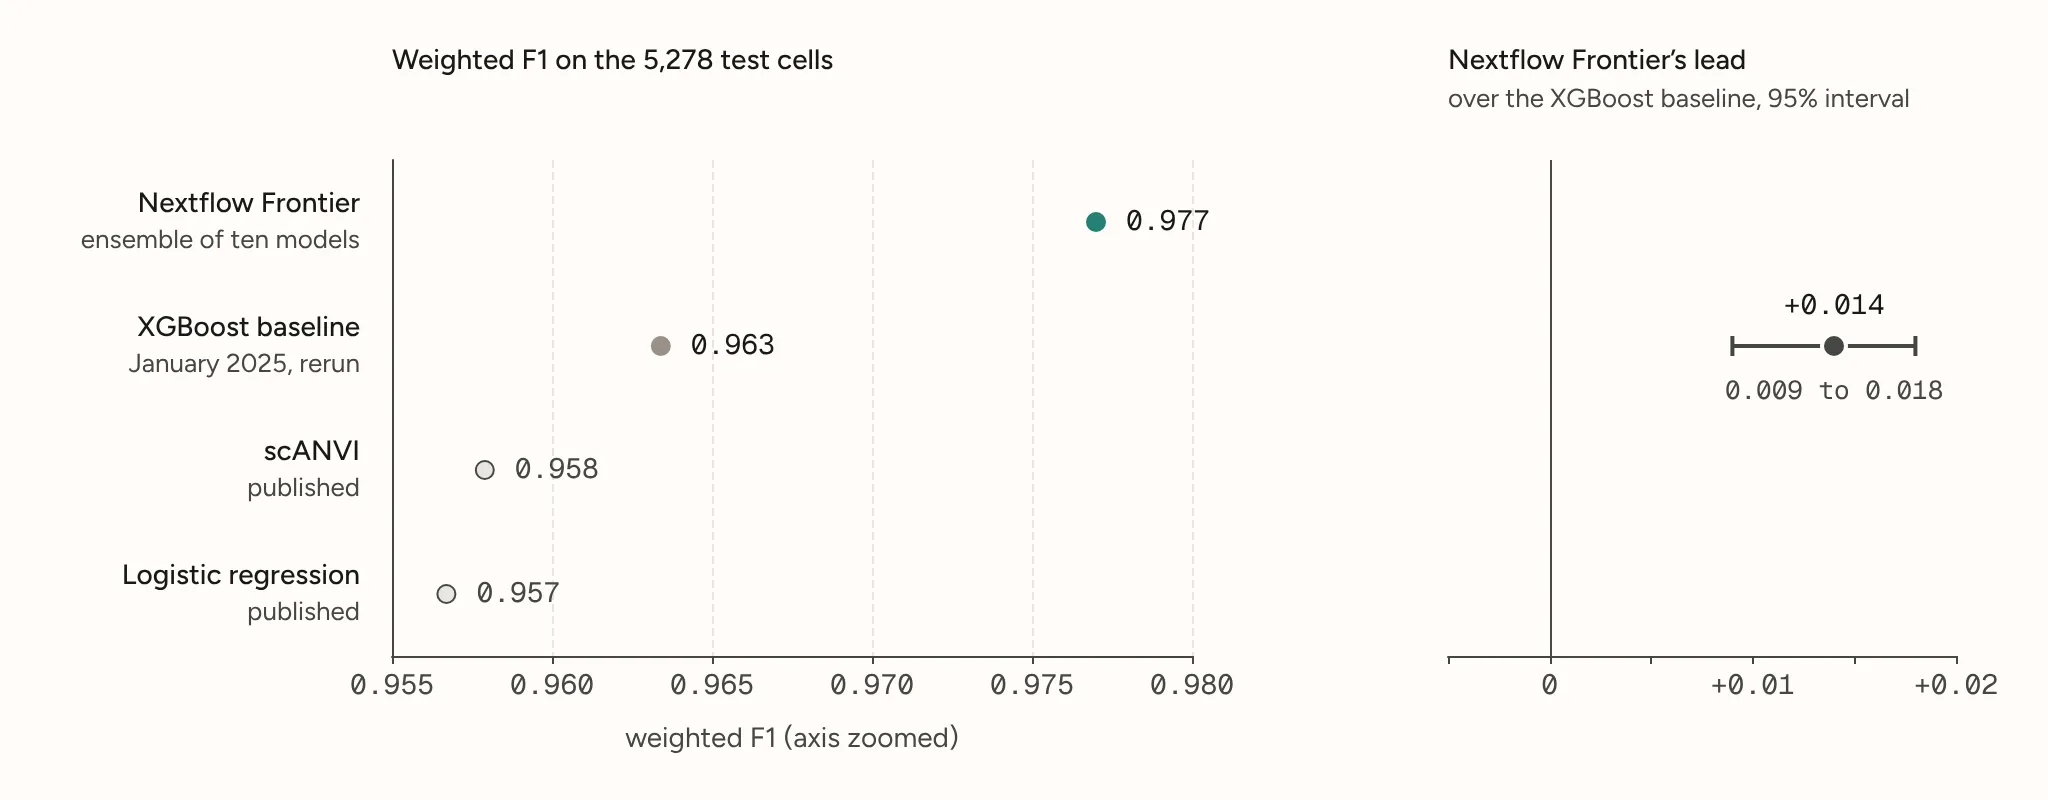
Nextflow Frontier classified 5,278 kidney cells from a donor left out of training into 13 cell types. An ensemble of ten models assigned each cell the label predicted by the most models, scoring 0.977 on the benchmark's 0-to-1 weighted F1 score, against 0.963 for the January 2025 XGBoost baseline, which we reran on the same cells.
We used Nextflow Frontier to improve cell-type annotation on a public benchmark of human kidney tissue. The task uses each cell’s gene-expression profile to assign one of 13 cell types, including podocytes in the kidney’s filters and principal cells in its collecting ducts (Wilson et al. 2022). These labels identify cell types associated with kidney structures; the benchmark does not measure each cell’s physical location. On the original test donor, the ensemble correctly classified 108 cells that the rerun XGBoost baseline misclassified, and misclassified 40 that the baseline classified correctly. Nextflow Frontier received scores on these cells throughout its search. We then retrained the ten model recipes without further tuning on ten other donors from the same study. The ensemble scored higher than the XGBoost baseline on average.
Why classifying kidney cells is hard
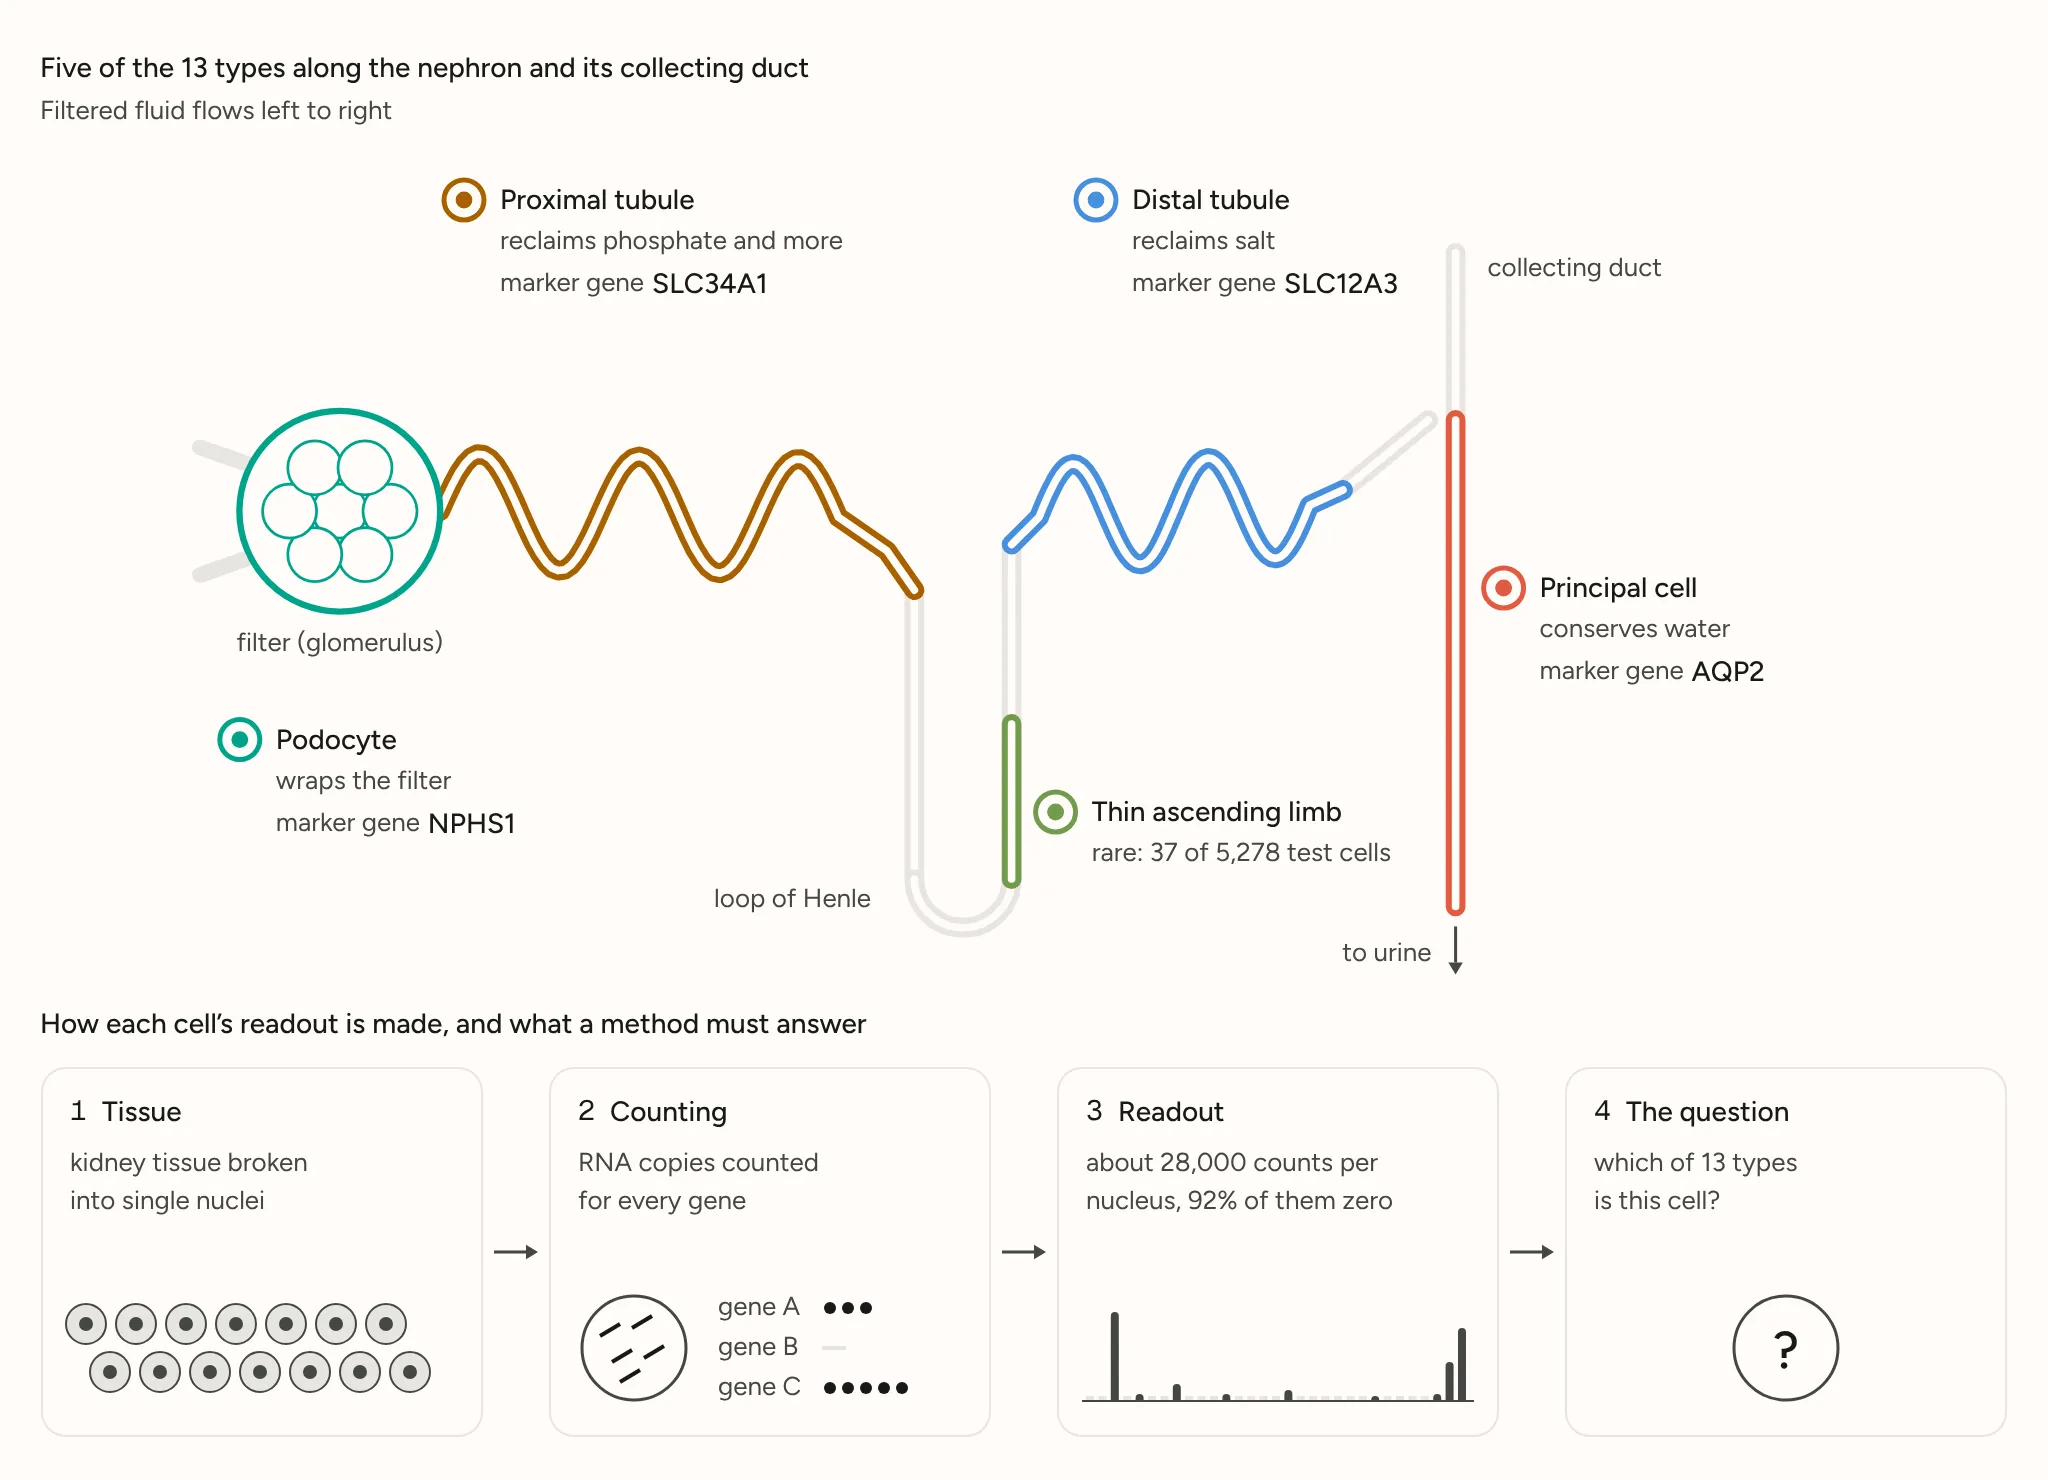
A single-cell experiment measures gene activity in thousands of cells from a piece of tissue. Researchers then have to identify each cell’s type from those measurements. Neighboring cell types share many active genes, which makes them hard to distinguish. To study how diabetic kidney disease affects podocytes, the cells in the kidney’s filters, researchers first have to distinguish them from 12 other types. Diabetes can damage these filters (Thomas et al. 2015).
The data come from single-nucleus RNA sequencing (Wilson et al. 2022). Researchers separate the nuclei from kidney tissue and count RNA copies for about 28,000 genes in each nucleus. RNA carries messages from active genes. Each nucleus becomes a row of counts that a model can read. In this dataset, 92% of the counts are zero. Many genes are inactive in a given cell, and the experiment captures only a small sample of its RNA (Jiang et al. 2022).
Researchers identify cell types using marker genes, which are active mainly in one type (Muto et al. 2021; Wilson et al. 2022). These markers are imperfect. The experiment may miss them in some cells, and other types may express them too. Software can learn from a reference dataset that researchers have labeled and assign those labels to new cells. This task is called label projection (Open Problems 2026). Incorrect labels can affect the studies that use them.
How the benchmark scores a method
Open Problems, a public benchmarking project for single-cell methods (Luecken et al. 2025), runs its cell-naming task on several datasets, one of them kidney tissue from 11 people, or donors, six without and five with diabetic kidney disease, described by Wilson et al. (2022). Open Problems gives a method 33,898 named cells from ten donors and asks it to name each of the 5,278 cells of the eleventh, the test donor, as one of 13 cell types. The test donor’s cell-type labels are withheld from the method and used by the scorer to evaluate its predictions (Open Problems 2026).
The score, weighted F1, runs from 0 to 1. A score of 1 means every cell is named correctly. For each type, it combines the share of that type’s cells the method found with the share of its predictions of that type that were correct. Open Problems averages the 13 results, giving more weight to common types (Open Problems 2026).
On the leaderboard run of 23 January 2025, the top score, 0.963, belonged to XGBoost, the baseline used here (Open Problems 2026); Open Problems’ two runs from 2026 scored it a little lower, 0.959 and 0.958, so we compare against 0.963, the higher score.
In the latest of those, a pre-release run from September 2026, a neural-network method, scANVI (Xu et al. 2021), scores slightly higher than XGBoost, 0.960 against 0.958. Nextflow Frontier’s ensemble scored 0.977, above both. We did not rerun scANVI, so that comparison uses its published score.
XGBoost builds a sequence of decision trees. Each tree asks yes-or-no questions about gene counts and helps correct the errors of the preceding trees (Chen and Guestrin 2016).
Nextflow Frontier let the trees read genes directly
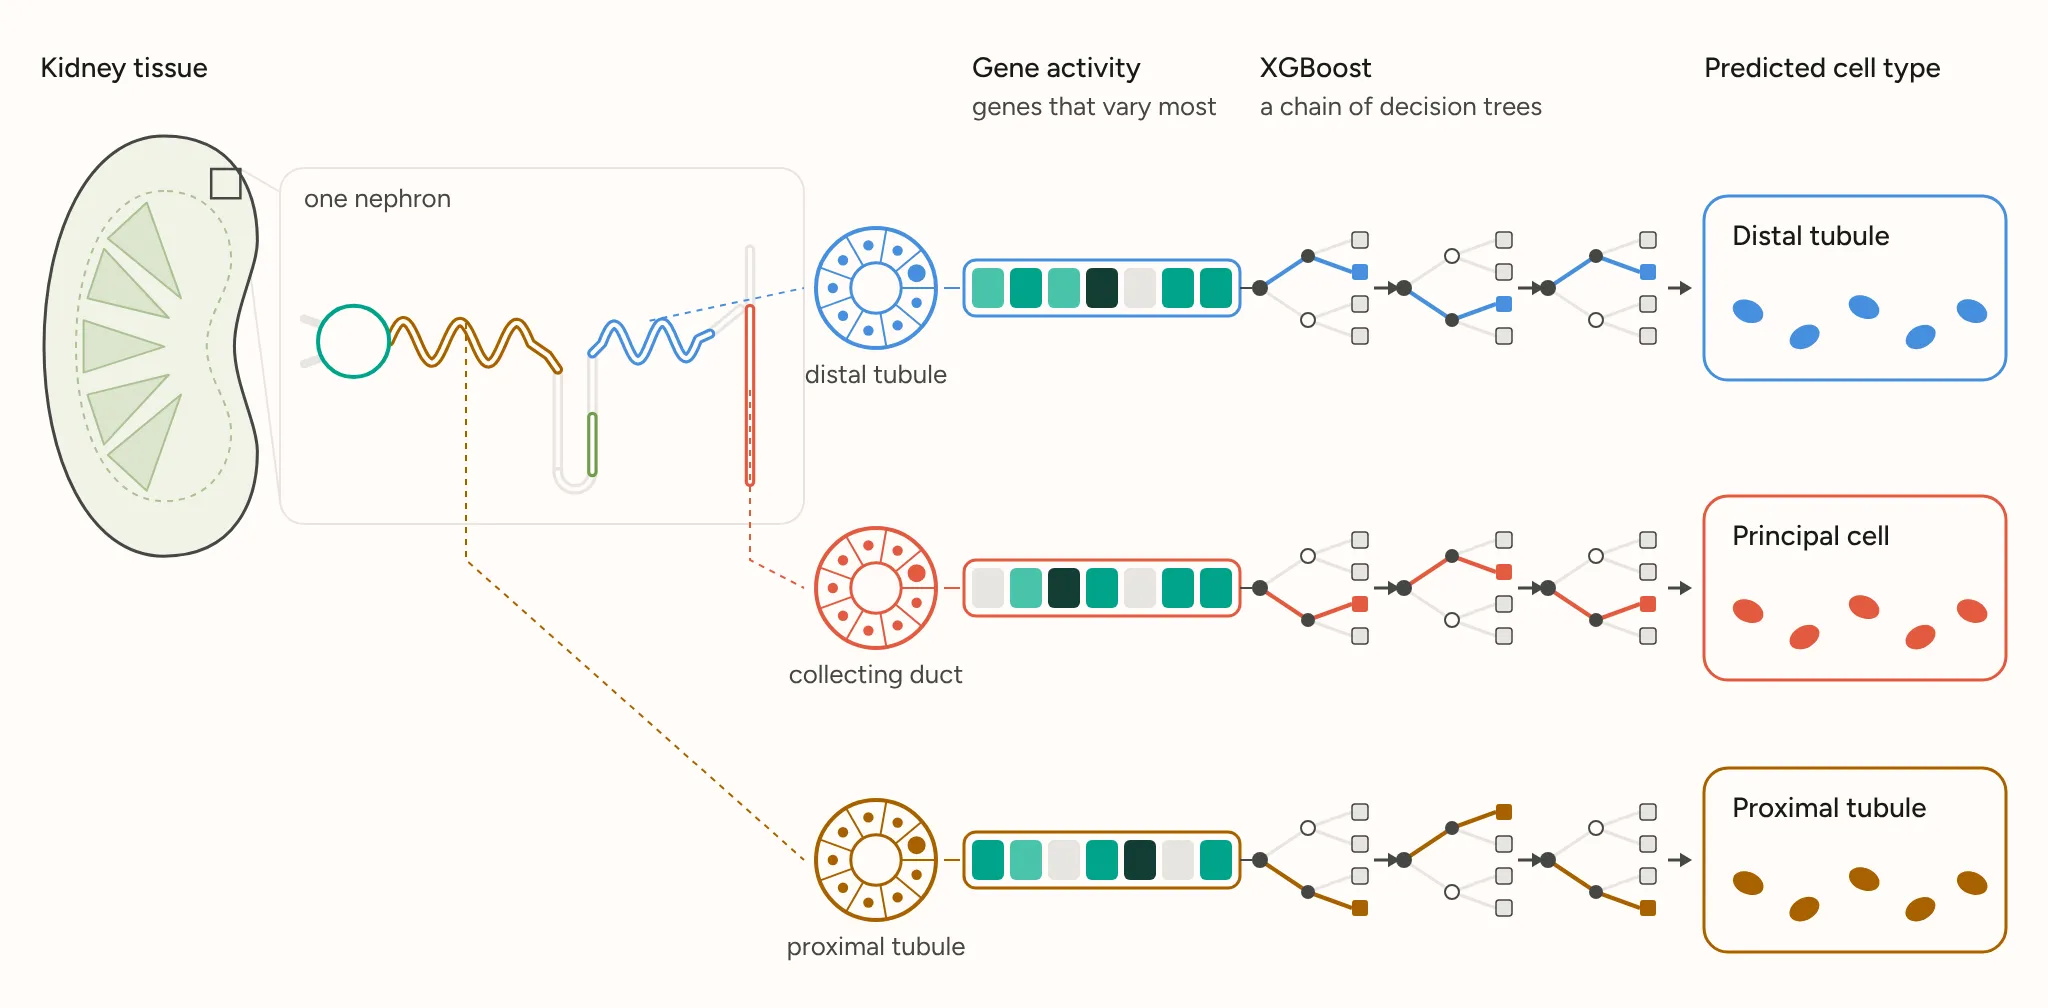
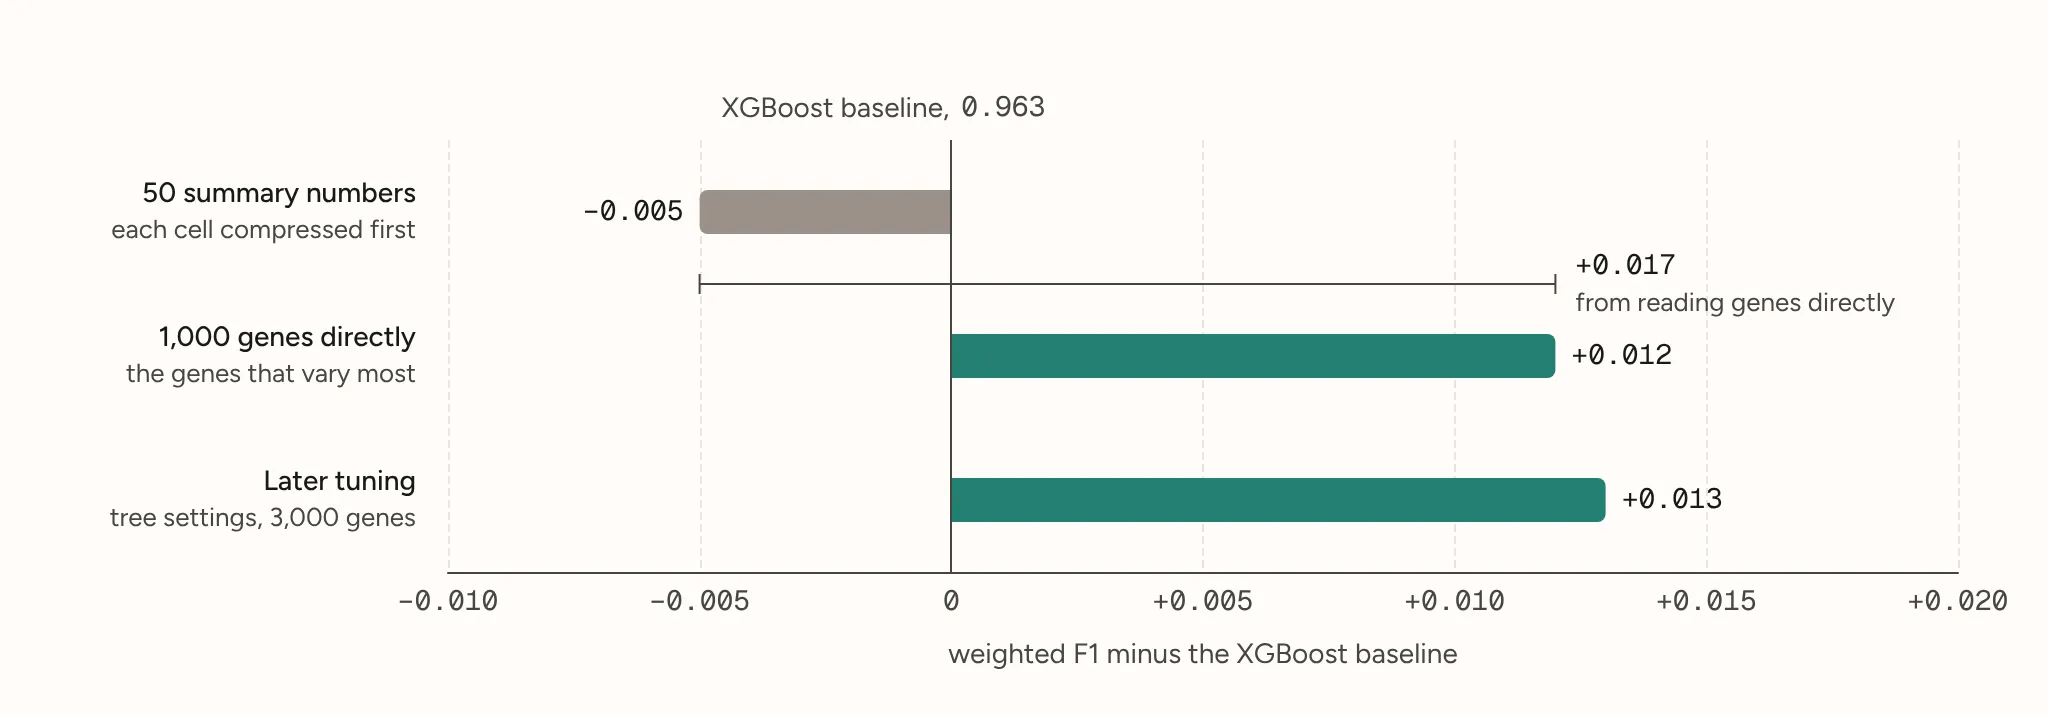
Over 263 scored attempts, Nextflow Frontier tried several methods and selected XGBoost, the same program as the baseline. It changed the inputs and tree settings. Simpler published methods on this leaderboard first compress each cell’s 28,000 counts into 50 summary numbers, each a weighted mix of many genes, and name the cell from those. They include logistic regression, which gives each number a weight and adds them up to pick the likeliest type, and k-nearest neighbors, which names a cell after the most similar named cells. Nextflow Frontier’s first boosted trees read those 50 numbers too, and the middle score of those attempts, with half scoring higher and half lower, was 0.958, below the baseline.
Nextflow Frontier then started a new series of attempts in which the trees read 1,000 genes directly: the ones that vary most from cell to cell. Open Problems ranks the genes this way once, on all the cells including the test donor’s but without using any cell names, and gives the ranking to every method. That series’ middle score was 0.975, above the baseline. Nextflow Frontier also tried six other kinds of method, among them k-nearest-neighbor label transfer, a neural network (scANVI), a support-vector machine and random forests; their middle scores were between 0.949 and 0.959, well below boosted trees reading genes.
Further tuning of the trees’ parameters and a longer list of 3,000 genes accompanied a smaller rise, about 0.001, in the middle score. These search comparisons do not isolate the effects of the input genes from tree settings.
A higher score on the same person’s cells
We combined ten tuned XGBoost models into an ensemble. Each cell received the label that the most models predicted. The ensemble scored 0.977 against 0.963 for the XGBoost baseline, whose rerun reproduced the published score exactly. Choosing the best single attempt instead would have raised the score by only 0.0015.
To estimate variation across cells, we sampled the 5,278 test cells with replacement 10,000 times and recomputed the score difference each time. The middle 95% of differences ranged from 0.009 to 0.018. This interval describes the chosen predictions on this donor. It does not account for selecting approaches and settings through repeated scores on the same cells.
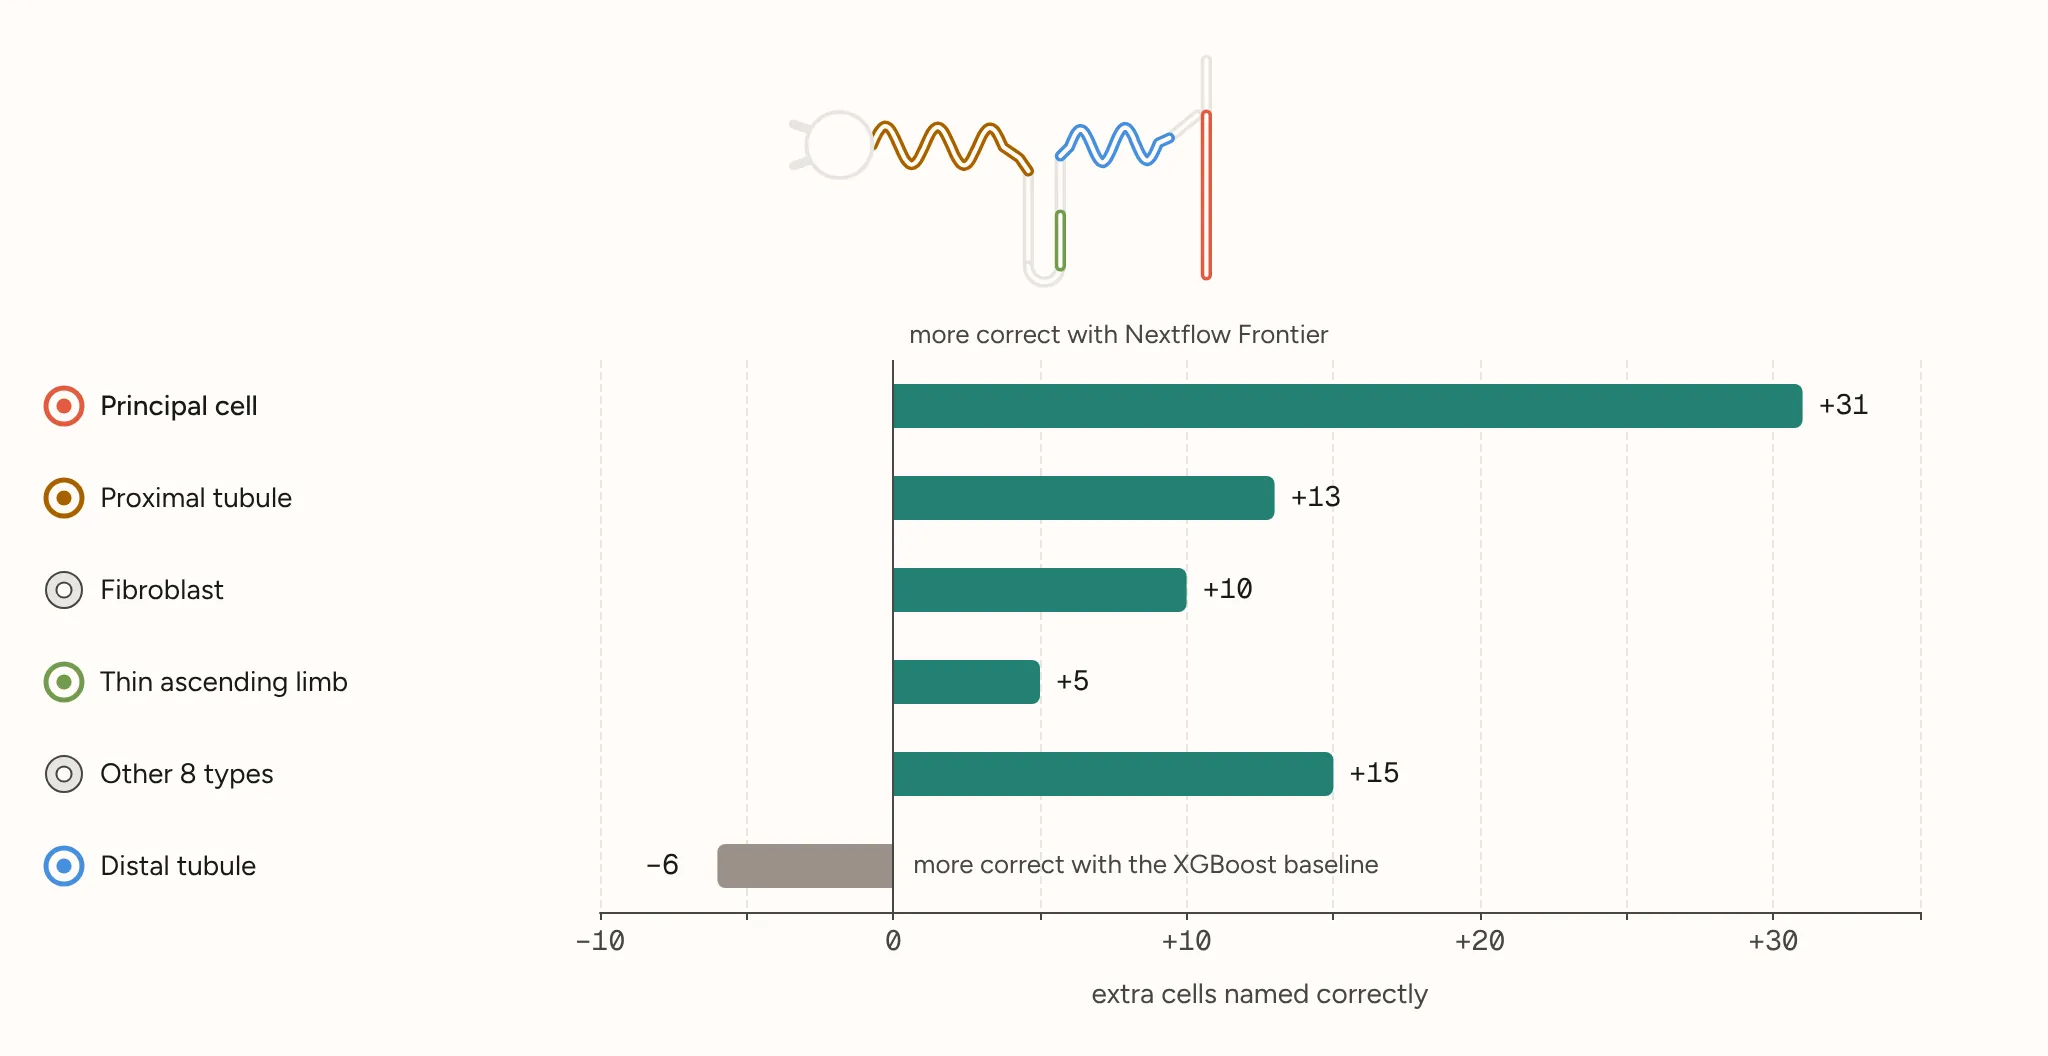
The ensemble mislabeled 120 of the 5,278 cells, compared with 188 for the baseline. That is more than a third fewer mistakes. It classified more cells correctly in 11 of the 13 types, the same number in one and fewer in one. When every type counts equally, it still scores higher, 0.953 against 0.922. The gain therefore extends beyond common types, though not every rare type improved. Principal cells had the largest gain, 31 cells. In this dataset, methods often confuse them with cells of the neighboring distal convoluted tubule.
The donor follow-up
The results above come from one person’s cells. We tested how the recipe performed across the ten other donors by leaving each donor out in turn, training on the remaining nine and scoring predictions for the donor left out. We kept the ten models’ parameters fixed and repeated this comparison for the XGBoost baseline.
The baseline’s score ranged from 0.887 to 0.974 across donors. On average, Nextflow Frontier’s ensemble scored 0.954 against 0.944. It scored higher for nine donors. On the tenth, the scores differed by 0.0001, at 0.9426 against 0.9427. It also scored higher than logistic regression for every donor and higher than k-nearest neighbors for all but that tenth donor, where they were level.
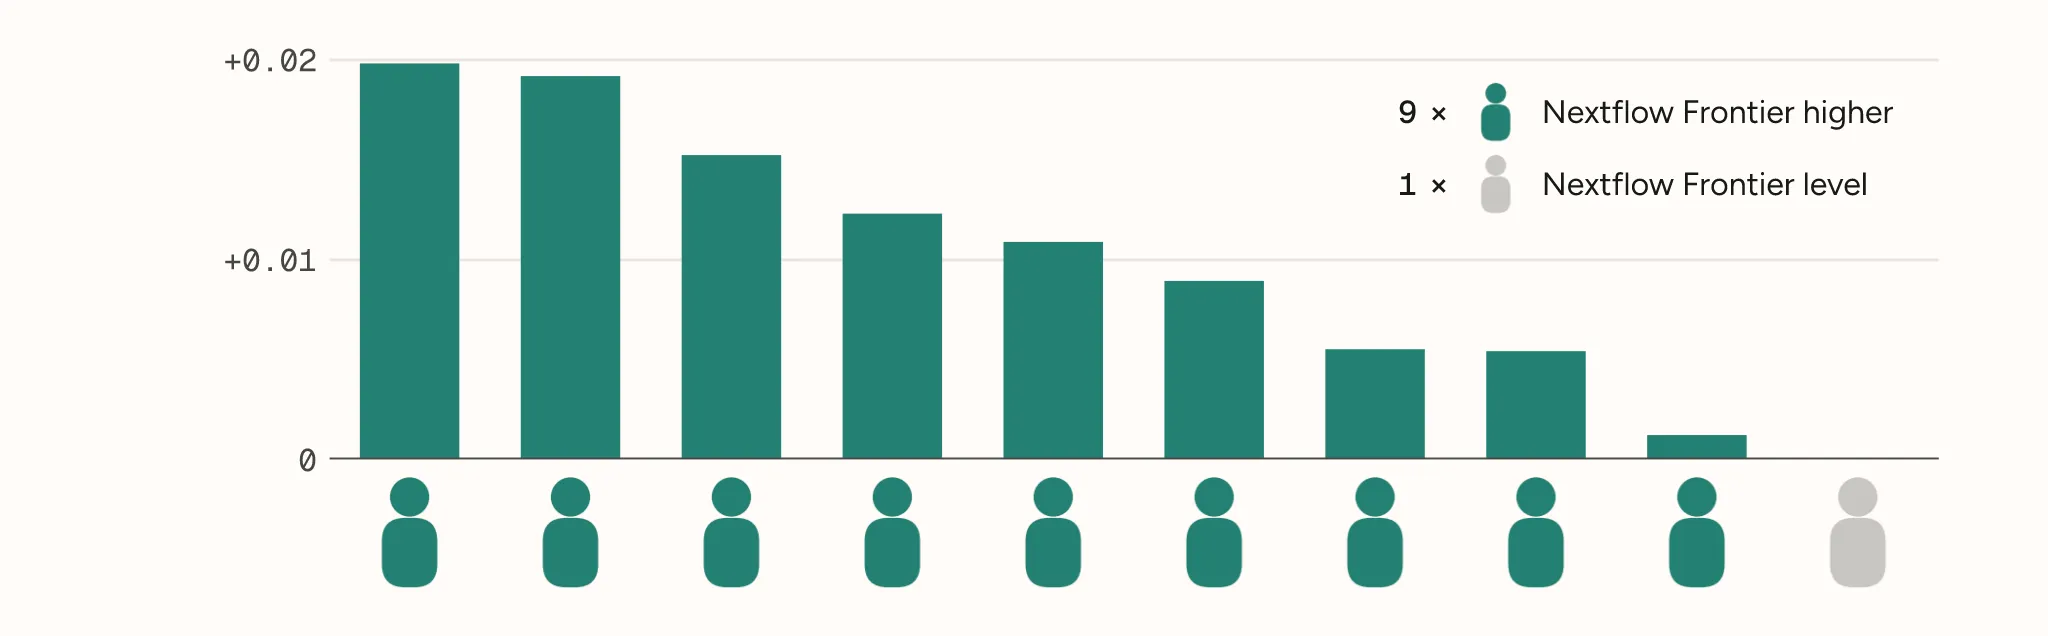
The follow-up tests ten additional donors from the same study. The search used the original test donor’s scores to choose the recipes, and the supplied gene ranking and preprocessing used the whole cohort. A separate audit found no recorded access to hidden cell labels in the evidence it inspected. That finding does not establish complete isolation or remove the effects of repeated test feedback.
The next test should fix the recipe in advance and evaluate donors from an independent study, with preprocessing built from training donors only. The recipe uses standard XGBoost with tuned settings, 610 to 1,100 rounds of adding trees and a few thousand genes selected by their variation between cells. If its advantage holds, labs could improve cell labeling in new kidney samples by changing how they run an existing tool. These results do not establish performance in other tissues or a discovery about kidney disease.
Summary
Nextflow Frontier improved kidney cell labeling by changing the inputs and settings of XGBoost. Trees that read genes directly scored higher than those that read 50 summary numbers per cell. An ensemble of ten tuned models then cut the January 2025 baseline’s mistakes by more than a third, improving classification in 11 of the 13 types. The fixed recipe also scored higher on average across ten additional donors from the same study. Testing it in a new study will show whether that advantage carries over to new kidney samples.
Bring Nextflow Frontier a computational problem and a way to evaluate its answers. It can search approaches, run them as reproducible workflows and help you decide which results are worth testing further.
References
- Chen L, Clark JZ, Nelson JW, et al. (2019). Renal-tubule epithelial cell nomenclature for single-cell RNA-sequencing studies. Journal of the American Society of Nephrology 30, 1358–1364. doi:10.1681/ASN.2019040415
- Chen T, Guestrin C (2016). XGBoost: a scalable tree boosting system. Proceedings of the 22nd ACM SIGKDD International Conference on Knowledge Discovery and Data Mining, 785–794. doi:10.1145/2939672.2939785
- Jiang R, Sun T, Song D, et al. (2022). Statistics or biology: the zero-inflation controversy about scRNA-seq data. Genome Biology 23, 31. doi:10.1186/s13059-022-02601-5
- Luecken MD, Gigante S, Burkhardt DB, et al. (2025). Defining and benchmarking open problems in single-cell analysis. Nature Biotechnology 43, 1035–1040. doi:10.1038/s41587-025-02694-w
- Muto Y, Wilson PC, Ledru N, et al. (2021). Single cell transcriptional and chromatin accessibility profiling redefine cellular heterogeneity in the adult human kidney. Nature Communications 12, 2190. doi:10.1038/s41467-021-22368-w
- Open Problems (2026). Label projection task, Diabetic Kidney Disease dataset, Open Problems in Single-Cell Analysis. Scores quoted here are from the results runs of 23 January 2025, 5 June 2026 and 21 September 2026 in the project’s public results archive; the page’s default leaderboard (release v2.0.0) shows the 23 January 2025 run, and the 2026 runs appear under its pre-releases. openproblems.bio/benchmarks/label_projection (accessed 10 October 2026).
- Thomas MC, Brownlee M, Susztak K, et al. (2015). Diabetic kidney disease. Nature Reviews Disease Primers 1, 15018. doi:10.1038/nrdp.2015.18
- Wilson PC, Muto Y, Wu H, et al. (2022). Multimodal single cell sequencing implicates chromatin accessibility and genetic background in diabetic kidney disease progression. Nature Communications 13, 5253. doi:10.1038/s41467-022-32972-z
- Xu C, Lopez R, Mehlman E, et al. (2021). Probabilistic harmonization and annotation of single-cell transcriptomics data with deep generative models. Molecular Systems Biology 17, e9620. doi:10.15252/msb.20209620
Interested in Nextflow Frontier?
Nextflow Frontier is a closed-loop discovery system built on Nextflow. It designs computational experiments, runs each one as a reproducible pipeline and learns from every result’s score what to try next, under the supervision of scientists.

Filed under Single-cell omics
All posts